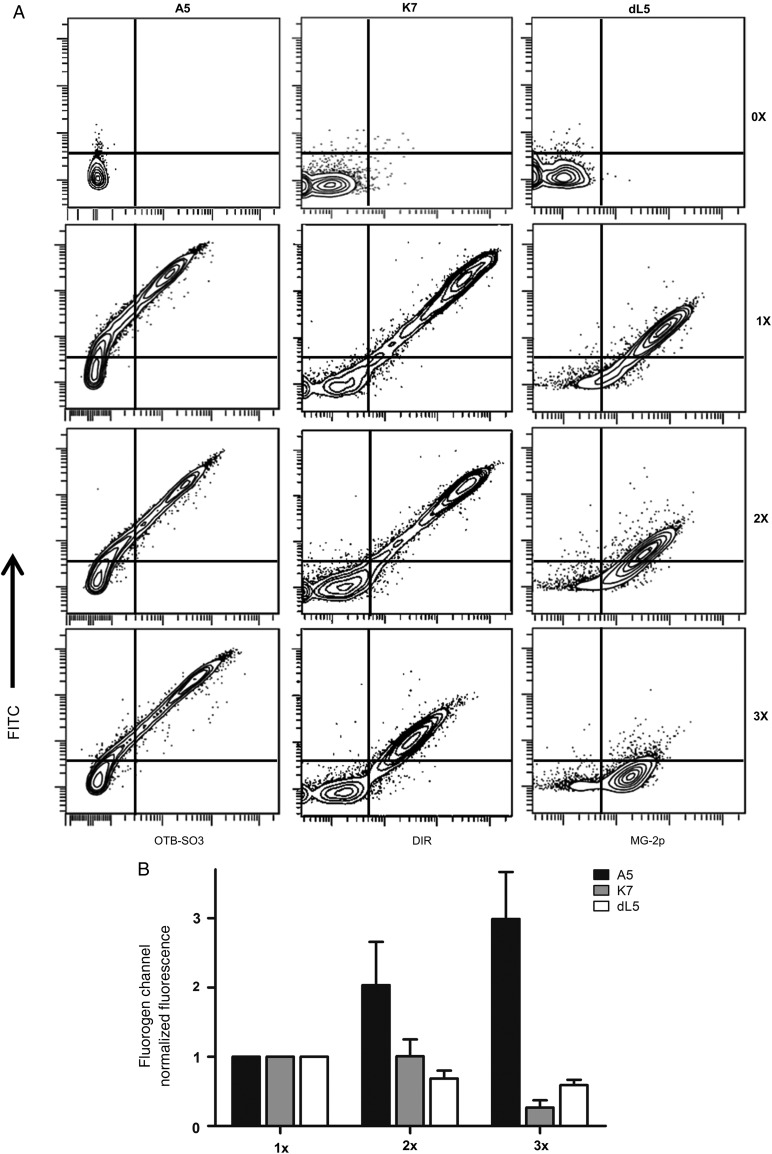
Fig. 5.
Determining fluorescence signal amplification of homo-scFv multimers. (A) Flow cytometry graphs from mammalian cells expressing a single (1×), double (2×) or triple (3×) homo-scFv multimers at the cell surface and co-labeled with anti-HA FITC antibody. (B) Summary graph of fluorogen fluorescence intensities from three independent flow cytometry experiments as presented above. All measurements were performed in the presence of 100 nM OTB-SO3, DIR or MG-2p fluorogens.

