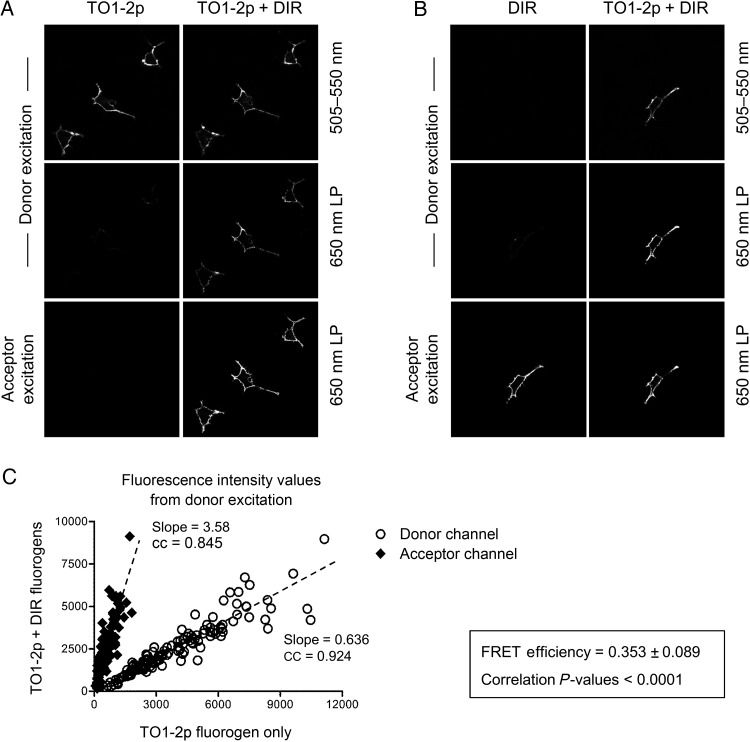
Fig. 6.
Assessing FRET between tandem scFv biosensors. (A) Micrographs of mammalian cells expressing A5 and K7 joined by a flexible linker at the surface. Images were acquired using a donor (TO1-2p) excitation 488 nm laser or an acceptor (DIR) excitation 561 nm laser and measured using two different band-pass filters, 505–550 nm for the TO1-2p emission channel and 650 nm LP for the DIR emission channel. The cell sample was first measured using only TO1-2p fluorogen, and subsequently measured after the addition of acceptor DIR fluorogen into the medium. The scale bar represents 30 μm. (B) Same as A; however, the cell sample was first measured using only DIR fluorogen, and subsequently measured after the addition of donor TO1-2p fluorogen into the medium. (C) Graph of mean pixel intensity values for different ROIs (n = 100) from a total of 42 images from three independent experiments. The values were determined using the donor (TO1-2p) laser excitation and measured from the donor and acceptor emission channels. Each sample was analyzed using only TO1-2p fluorogen, and subsequently analyzed after the addition of acceptor DIR fluorogen into the medium. All data show strong correlation with P < 0.001 and cc close to 1. All the experiments were performed using 300 nM TO1-2p and/or 150 nM DIR fluorogens.

