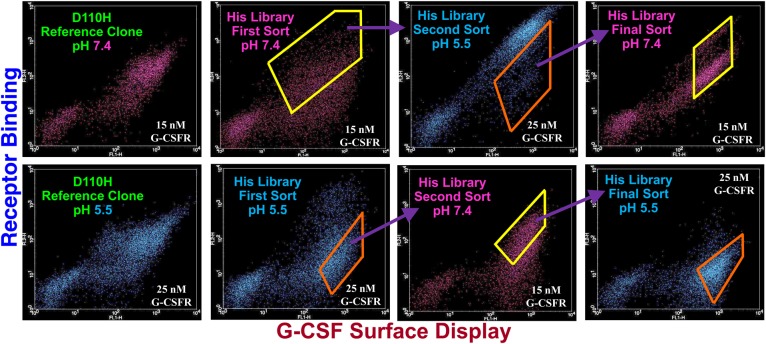
Fig. 2.
Dot plots for D110H reference clone and combinatorial G-CSF His variant library sorts. Y-Axes denote fluorescence corresponding to G-CSF binding affinity. X-Axes denote fluorescence corresponding to yeast surface display level. Combinatorial library 7/5/7 sort series depicted in upper dot plot panel. Combinatorial library 5/7/5 sort series depicted in lower dot plot panel. D110H single His mutant dot plots used as references for library sorting appear in left panels. Yellow polygons denote library clones enriched at pH 7.4 and orange polygons denote library clones enriched at pH 5.5. Sorting at pH 7.4 carried out with 15 nM G-CSFR. Sorting at pH 5.5 carried out with 25 nM G-CSFR.

