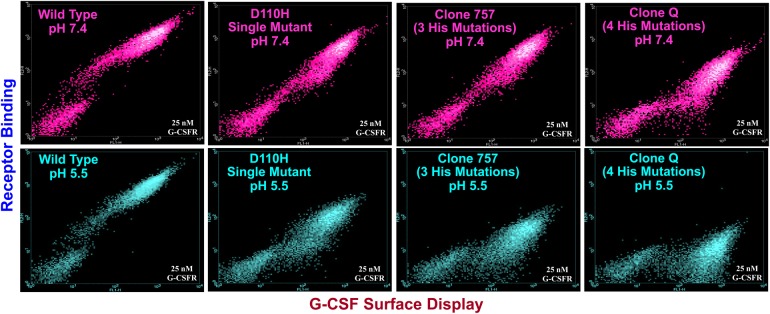
Fig. 3.

Comparison of dot plots at pH 5.5 (cyan) and pH 7.4 (magenta) for G-CSF wild type, D110H single mutant, clone 757 and clone Q. Y-Axes denote fluorescence corresponding to receptor binding. X-Axes denote fluorescence corresponding to G-CSF surface display. All analyses performed with 25 nM G-CSFR.
