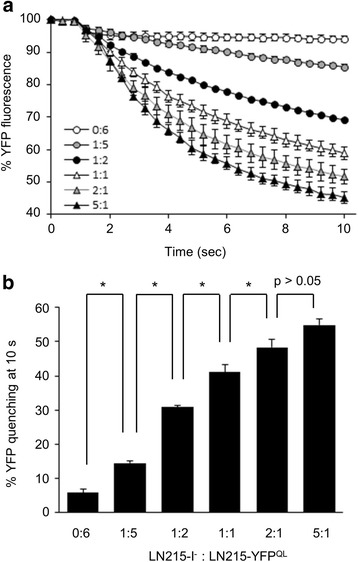
Fig. 3.

Determination of the optimal ratio of donor and acceptor cells. LN215-I- and LN215-YFPQL cells were mixed and plated on 96-well plates at ratios of 0:6, 1:5, 1:2, 1:1, 2:1, 5:1 and 6:0 and incubated for 24 h. After culture media were replaced with 100 μL of C-solution, the plate was inserted into the multi-plate reader. The YFPQL fluorescence of each well was read every 0.4 s for 10 s. One second after the first measurement, 100 μL of I-solution was added by the automatic injector in the plate reader. Assay of each group was performed in three wells. The mean fluorescence intensity of the 6:0 group at each time point was considered as background and subtracted from fluorescence intensities of the other groups at the corresponding time point. Then, the relative YFP fluorescence at each time was normalized to the fluorescence of the starting point and plotted against time. Error bars represent standard deviations (a). The percent final YFP quenching was calculated and expressed as mean ± standard deviation (b). *, p < 0.05 (Student t-test)
