Fig. 4.

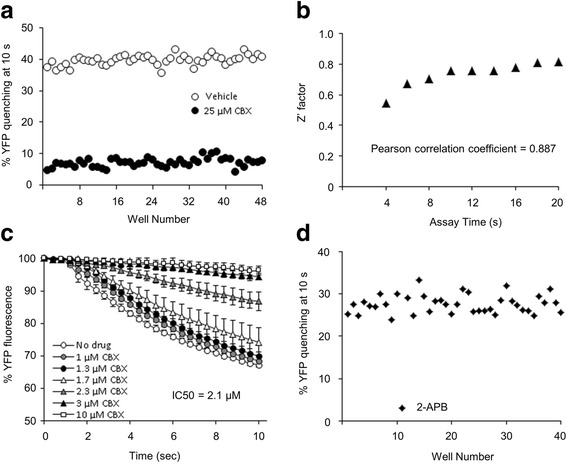
Performance of I−-YFP GJIC assay as a HTS system. To assess the quality of the I−-YFP GJIC HTS assay, a 2:1 mixture of LN215-I- and LN215-YFPQL cells was plated on a 96-well plate. After 24 h of cultivation, vehicle (water) or 25 μM of CBX diluted in C-solution was added to the well for 10 min, with each treatment being applied to 48 wells. To investigate the effect of assay time on Z’ factor, the I−-YFP assay was conducted for 20 s per well. The percent YFP quenching at 4, 6, 8, …, and 20 s was calculated. The values at 10 s were plotted against well number (a). Z’ factors were calculated using positive (CBX) and negative (vehicle) control data at each time point, as described in the Methods section, and the results were plotted against assay time. Pearson’s correlation coefficient was calculated in Microsoft Excel 2010 using Pearson’s function, which was 0.887 (b). The mixed cultures were treated with CBX at 0, 1, 1.3, 1.7, 2.3, 3 and 10 μM in C-solution for 10 min before the GJIC assay. Each treatment was added to five wells. The mean % YFP fluorescence was plotted against time. Error bars represent standard deviations. The IC50 for GJIC activity by CBX was calculated with GraphPad Prism 4 (GraphPad Software) (c). The 40 chemicals listed in Additional file 5 were applied to the mixed cultures before the GJIC assay. All chemicals were applied at a concentration of 25 μM. The % YFP quenching at 10 s was plotted against chemical number. All GJIC activities were within the range of the mean ± standard deviation except when 2-APB was applied (d)
