Figure 3.

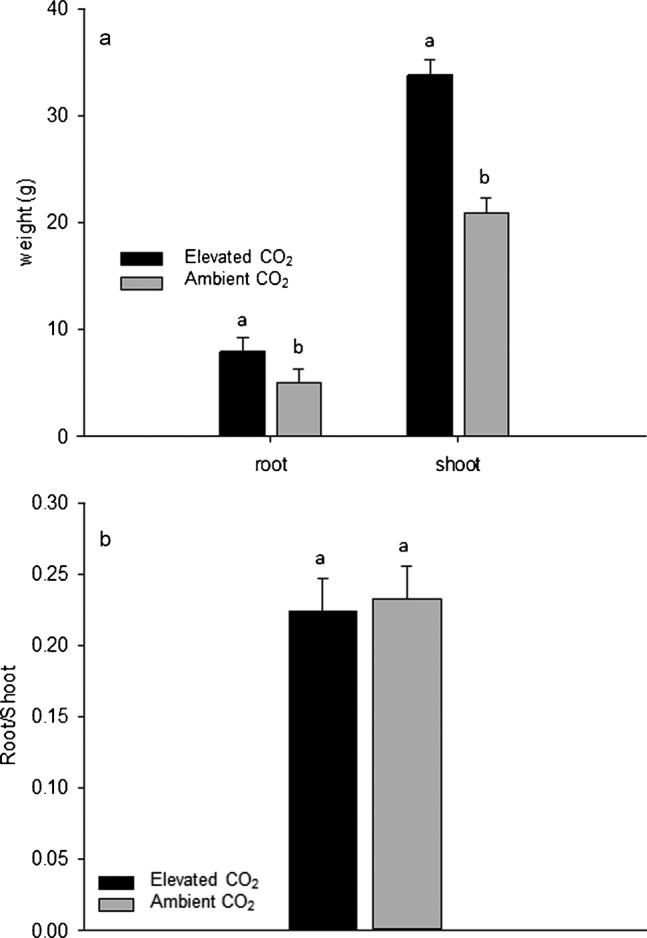
Root and shoot dry weights (a) and root to shoot ratios (b) after 84 days of elevated carbon dioxide treatment. Different letters atop bars indicate significant differences (p≤0.05) between treatments on a given sampling day.

Root and shoot dry weights (a) and root to shoot ratios (b) after 84 days of elevated carbon dioxide treatment. Different letters atop bars indicate significant differences (p≤0.05) between treatments on a given sampling day.