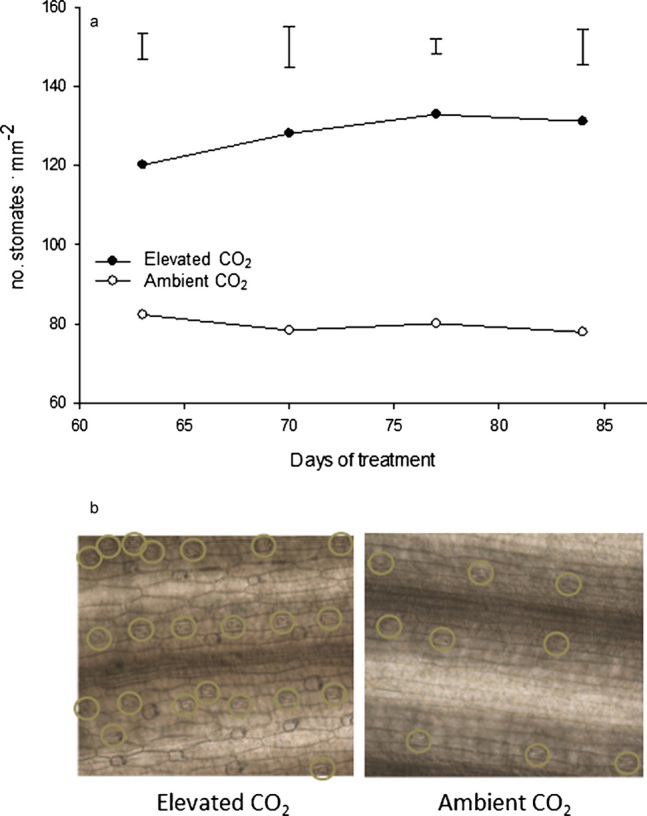
Figure 7.

Stomatal densities (a) at 63, 70, 77 and 84 days of elevated carbon dioxide treatment. Vertical bars indicate LSD values (p≤0.05) for comparison between treatments on a given day where significant differences were detected. Photos (b) of creeping bentgrass stomates at 84 days of treatment with elevated or ambient CO2 concentrations.
