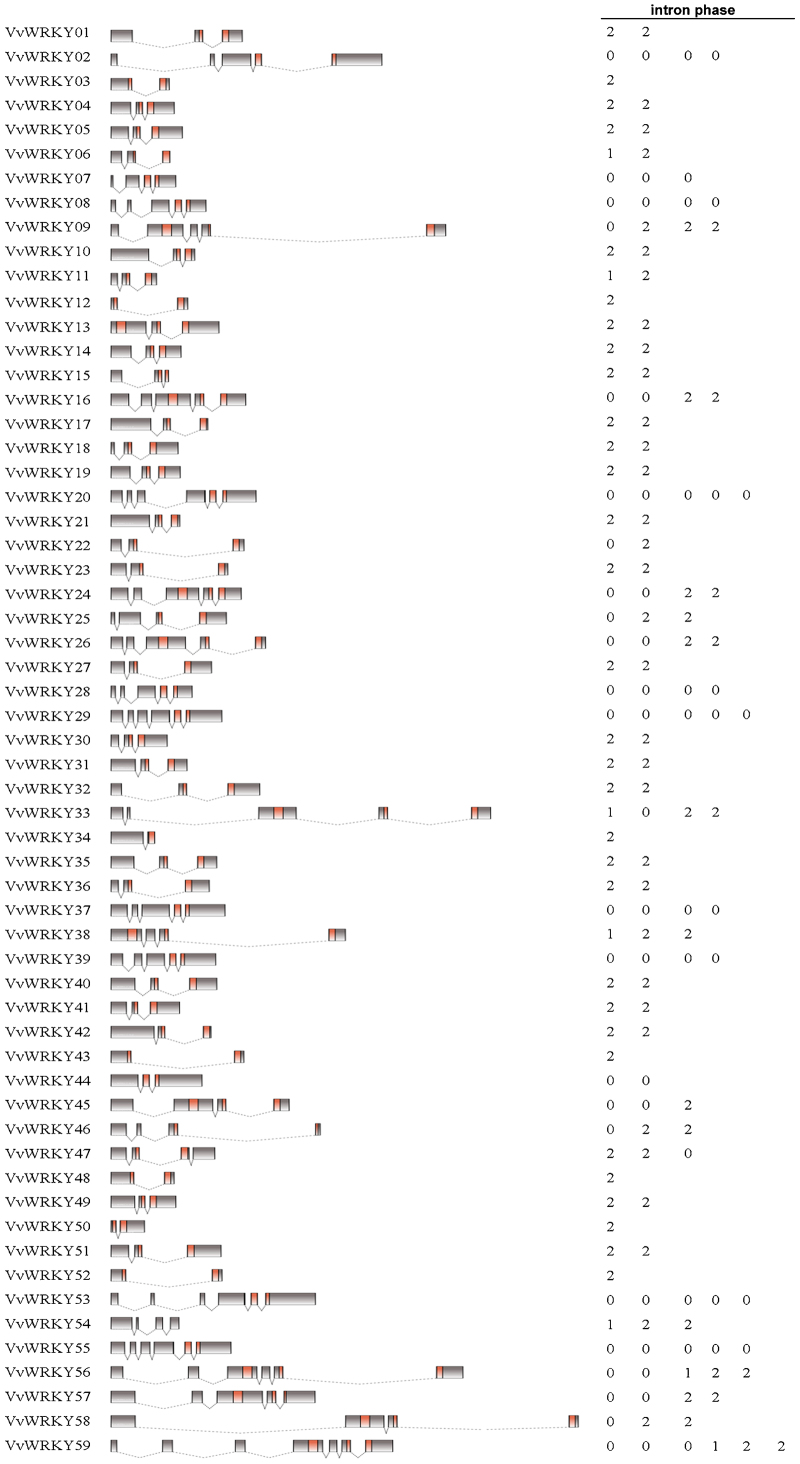
Figure 2.
Structures of VvWRKY genes. Exon–intron composition of VvWRKY genes. Names of genes are indicated on the left. Exons, represented by black or red boxes, were drawn to scale. Dashed lines connecting two exons represent an intron. Intron phases 0, 1 and 2 are indicated by numbers 0, 1 and 2, respectively. WRKY domains in VvWRKY proteins are marked in red.

