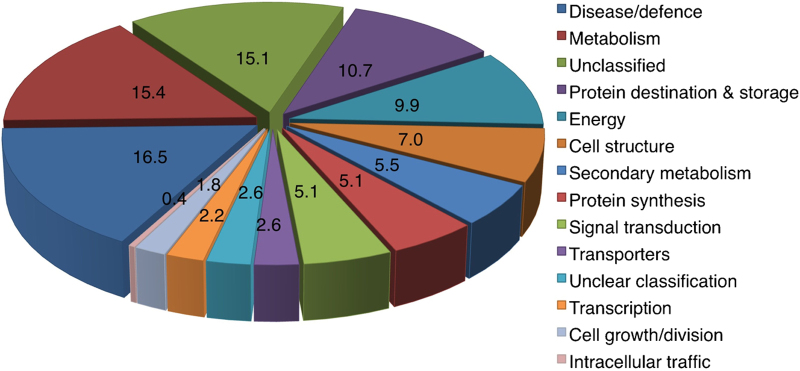
Figure 4.

Classification of the differentially expressed proteins. Following 2-DE, protein spots were visualized by SYPRO® Ruby staining and comparatively analyzed with Delta 2D (Decodon). Differentially expressed spots were identified using LC-MS/MS and classified into functional categories according to Ref. 34.
