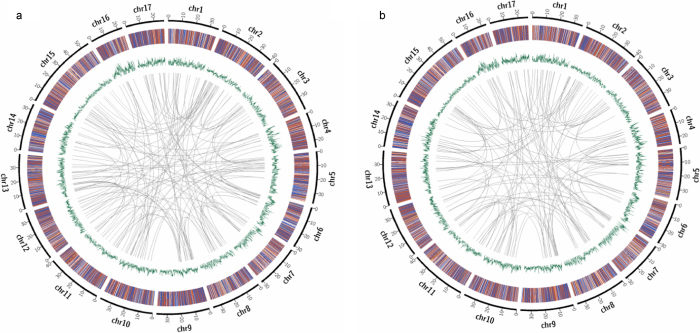
Figure 2.
Diagrammatic representation of structural variation in the sequence data obtained from the resequencing of ‘Indo’ (a) and ‘Su Shuai’ (b). The average genome coverage was ∼96%. The 17 chromosomes are portrayed along the perimeter of the outer circle. Insertions (purple), deletions (blue), deletions which contain an insertion (orange) or inversions (red) are represented in the second circle. The third circle represents the distribution of SNP density (green), i.e., the number of SNPs within 100 kb of each dot. The innermost circle indicates intrachromosomal and interchromosomal (gray) transfer, indicated by connections between segments.

