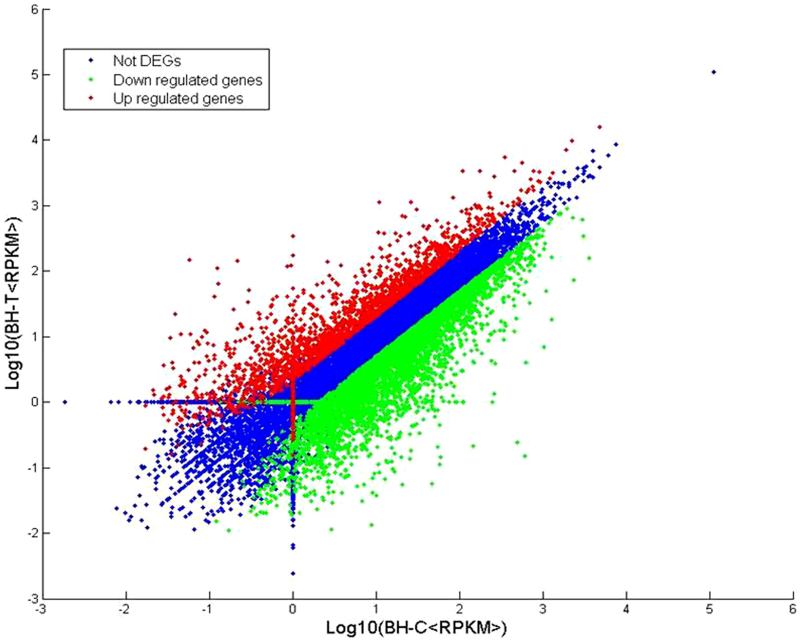
Figure 1.
Distribution of gene expression levels. Red dots (2073) represent more prevalent transcripts in the infected PM leaf library; lower frequencies in the infected tissue are represented by green dots (4468); and transcripts showing no significant differences are represented by blue dots (15 068).

