
Figure 2.
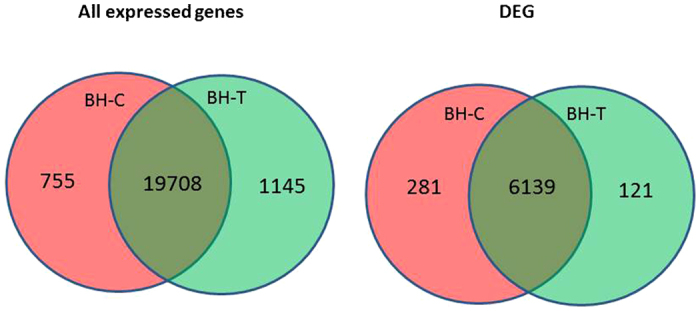
Venn diagrams of gene expression in control (BH-C) and PM-inoculated (BH-T) samples. The Venn diagram on the left indicates that a total of 21 609 sequences were identified in both libraries (combined) and that 755 were unique to the BH-C library, 1145 were unique to the BH-T library and 19 708 were common to both libraries. The Venn diagram on the right indicates that 281 DEGs were uniquely upregulated in the BH-C library, 121 were downregulated in the BH-T library and 6139 were either up- or downregulated in one of the libraries.