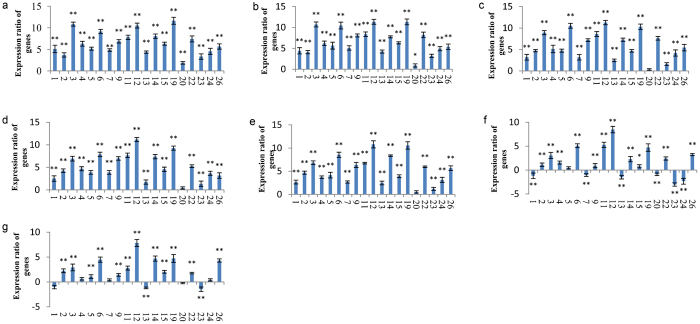
Figure 4.
Gene expression patterns in module 17 treated with heat shock and recovery at different time points. a–e: heat shock for 0.5, 1, 2, 3 and 6 h, respectively. f–g: heat shock recovery for 2 and 5 h after plants were treated at 40 °C for 1 h, respectively. The value in the Y-axis is −ΔΔCt. The expression ratio of a gene was considered significant if *p<0.05. Expression ratio of genes was significant if **p<0.01. The numbers from 1 to 26 on the X-axis represent the grapevine genes listed under ‘gene number and grapevine gene’ in Table 1.

