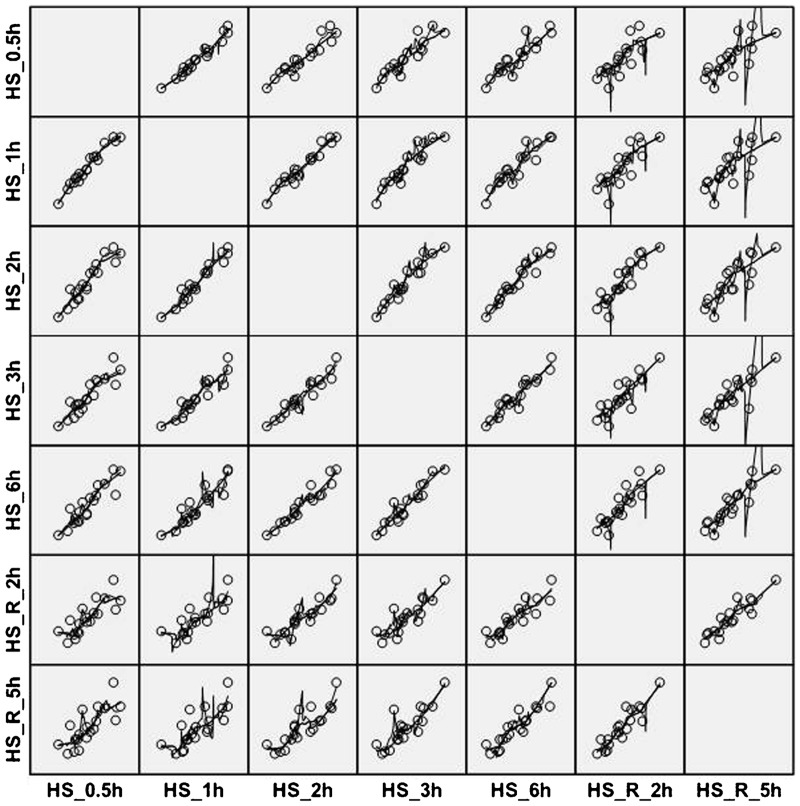
Figure 5.
The goodness of fit test of 19 gene expression values in module 17 between each two time points treated with heat shock and subsequent recovery. The fit lines were added by using LOESS in the matrix scatterplot. ‘HS’ represents heat shock treatment. ‘HS_R’ represents recovery after heat shock treatment.

