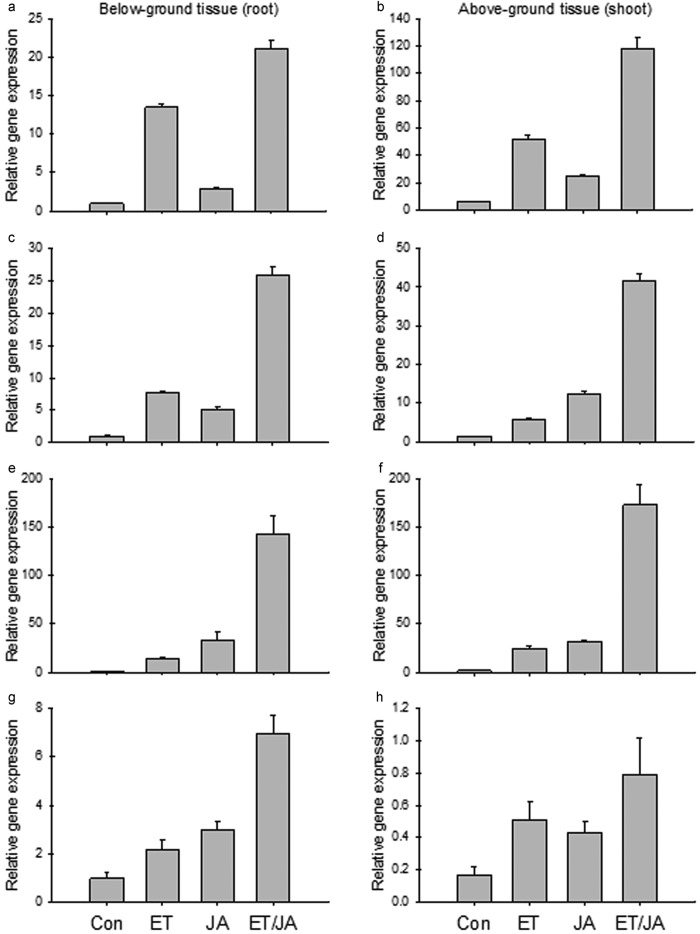
Figure 6.
Gene expression profile of two apple MdERF1s with ET and JA treatment: (a and b) MdERF1 (MDP0000235313); (c and d) MdERF1 (MDP0000127134); (e and f) MdERF (MDP0000880063); (g and h) MdCHIB (MDP0000430546); (a, c, e and g) under-ground tissue (roots); (b, d, f and h) above-ground tissue (shoot). ET: 110 ppm ethylene only; JA: 500 µM methyl jasmonate only; ET/JA: ethylene and methyl jasmonate together. Each data point represents the means with standard error.

