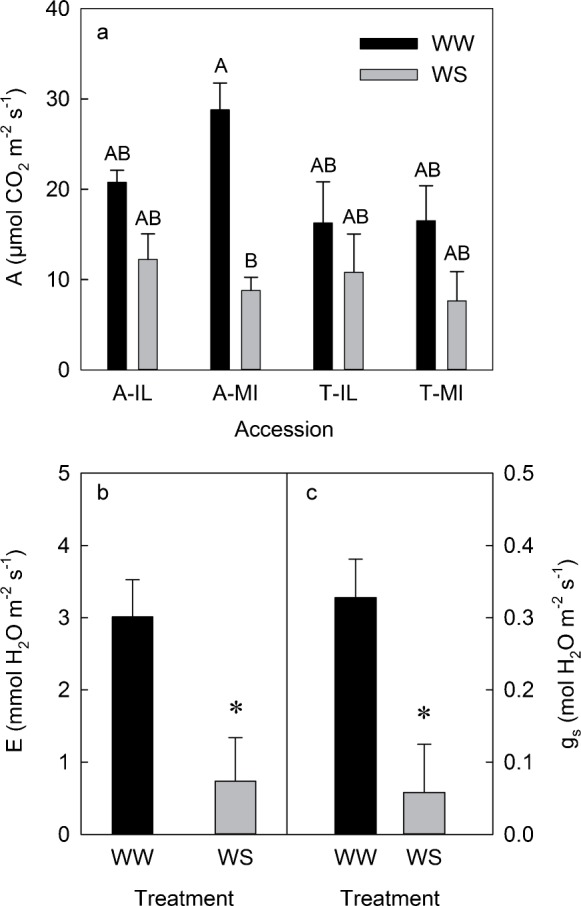
Figure 5.

Net CO2 assimilation rate (A, a) of S. alba and S. tomentosa accessions from Illinois (A-IL and T-IL) and Michigan (A-MI and T-MI) exposed to well-watered (WW, black columns) or 45 days of water-stress (WS, gray columns) treatments. Columns are means (n=4–5) and bars are ±s.e. Transpiration rate (E, b), and stomatal conductance (gs, c) of well-watered (WW, black columns) or 45 days of water-stress (WS, gray columns) treatments. Asterisks indicate significant differences between treatments at *p<0.05.
