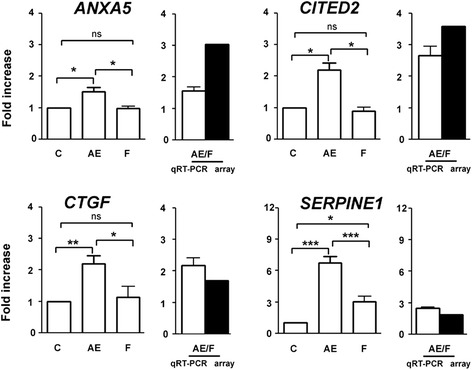
Fig. 4.

Quantitative real-time PCR validation of genes found to be overexpressed in AREG/EREG vs. FSH microarray. The relative abundance of specific gene mRNA is expressed in arbitrary units as fold increases in the specific gene /HPRT ratio over the level found in the control group at the time 0 h. C control, AE AREG/EREG, F FSH. P < 0.05 for single asterisk; P < 0.01 for double asterisk; P < 0.001 for triple asterisk
