Fig. 2.

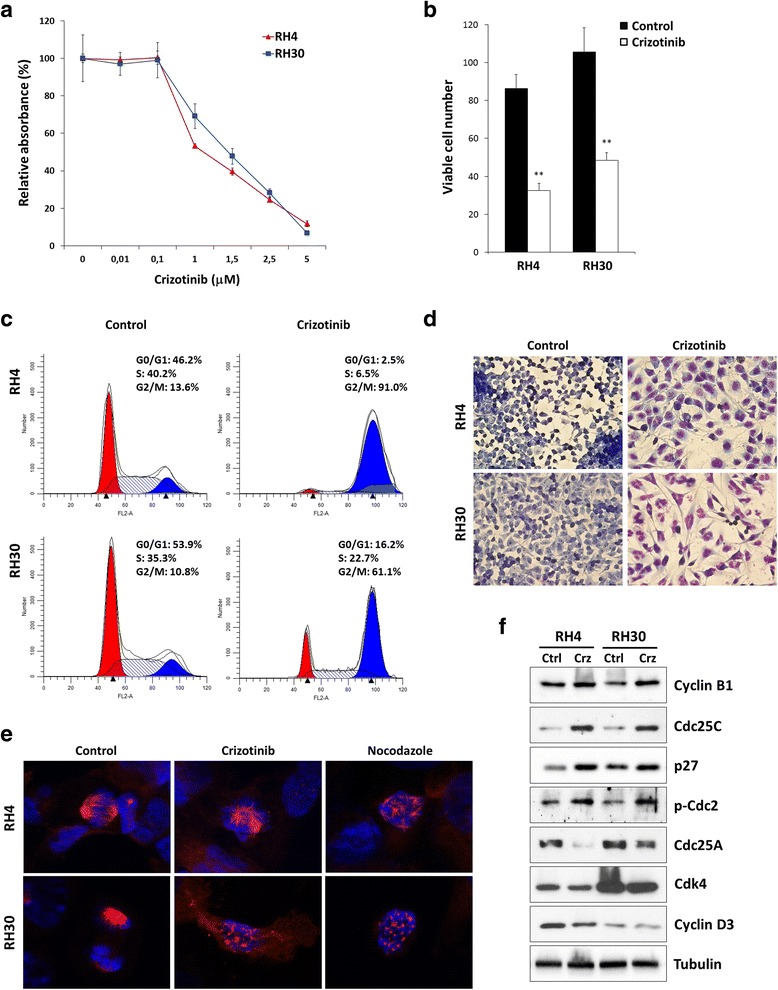
Effects of crizotinib on cell proliferation and morphology of RH4 and RH30 cell lines. a RH4 and RH30 cells were incubated for 72 h with crizotinib at the indicated concentrations. The MTT assay was performed to assess relative cell numbers, which were plotted as a percentage of cell viability calculated with respect to control cells treated with DMSO alone (0 μM considered at 100 %). Each point is the mean of nine replicate wells ± standard deviation (SD) and is representative of three independent experiments. b RH4 and RH30 were plated on 12-well plates and treated with 1.5 μM crizotinib for 72 h. Control represents DMSO-treated cells. Viable cells were counted by trypan blue exclusion staining and each bar represents the mean value of three independent experiments ± SD. Statistical significance: **, p < 0.01. c Flow cytometry data represented as histograms showing percentages of cells in G0/G1, S and G2/M phases in RH4 and RH30 cells after treatment with 1.5 μM crizotinib for 48 h. Control cells received DMSO at the same concentration. Data are average values of three independent experiments. d Giemsa staining showing morphologic changes observed in RH4 and RH30 after 48 h of treatment with 1.5 μM crizotinib or mocked control. Cellular morphology was analysed under light microscope at 40× magnification. e Immunofluorescence analyses showing the effect of crizotinib on microtubule dynamics. Normal bipolar spindle formation was altered in RH4 and RH30 cells treated for 24 h with crizotinib. Cells were stained for tubulin (red) and DNA (blue). Nocodazole was used as positive control for microtubule depolymerisation. Control cells were treated with DMSO. f Western blot analyses of a panel of cell cycle regulatory proteins in RH4 and RH30 cells treated with 1.5 μM crizotinib (Crz). Control cells (Ctrl) were treated with DMSO. Tubulin expression was used as the internal control
