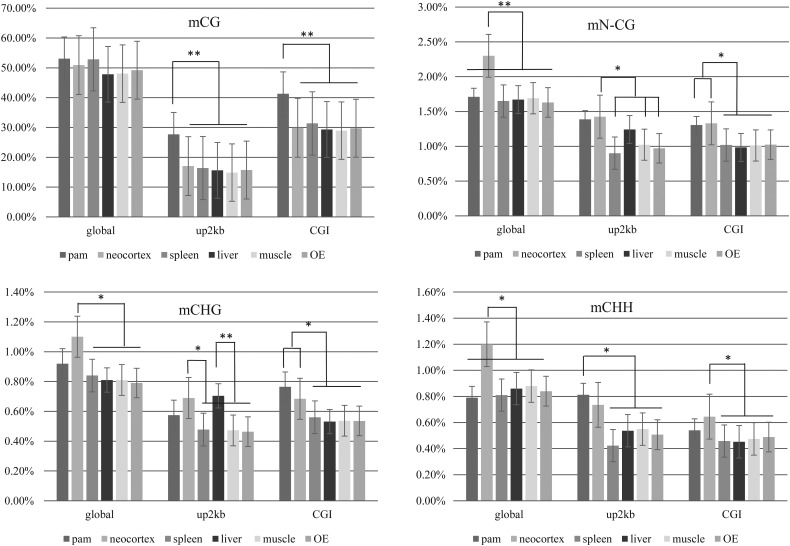
Figure 3.
Comparison of the percentage methylation level of CpG and non-CpG sites among different tissues. Methylation level was indicated according to different criteria including global, 2 kb upstream of TSS (up2 kb) and CGI. Non-CpG methylation was separately evaluated for mCHG and mCHH. PAM, pulmonary alveolar macrophage; OE, olfactory epithelium. Percentage methylation of CpG sites (A), non-CpG (B), CHG (C) and CHH (D) for global, up2 kb and CGI. ** denotes P < 1 × 10⁻⁵, * denotes P < 1 × 10⁻³.

