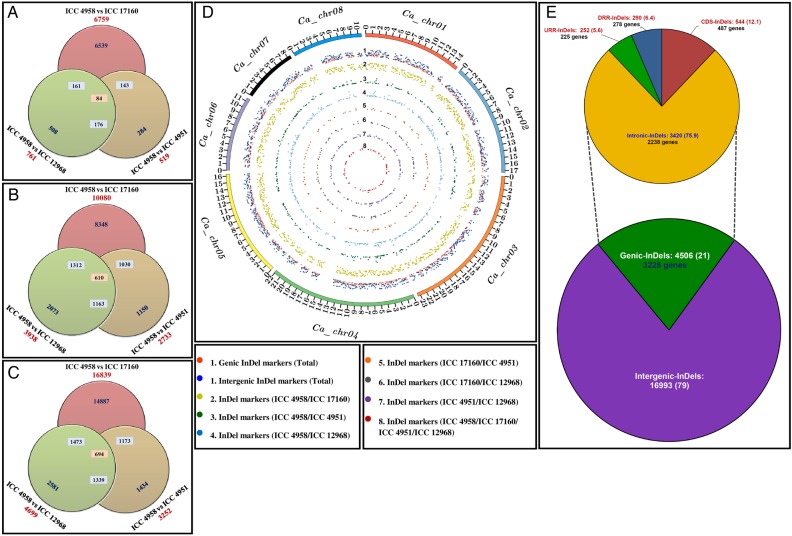
Figure 2.
Genomic constitution and genome-wide distribution pattern of 21,499 InDel markers developed by comparing the genome sequences of four different desi (ICC 4958 and ICC 4951), kabuli (ICC 12968) and wild (ICC 17160) chickpea accessions. InDel markers identified from diverse possible-pair combination (indicated by individual circles) of four accessions that were physically mapped on eight chromosomes (A) and unanchored scaffolds (B) as well as sum of the whole chickpea genome (C) are depicted by Venn diagrams. (D) The frequency and relative distribution of 7,643 InDel markers physically mapped on eight chromosomes of desi chickpea genome are illustrated by a Circos circular ideogram. The outermost circles signify the different physical size (Mb) of eight chromosomes coded with multiple colors as per the pseudomolecule size documented in desi chickpea genome.14 (E) Relative frequency of 21,499 InDel markers identified from the intergenic and various coding and non-coding (introns and regulatory regions) sequence components of 3,228 genes annotated from desi genome. Parenthesis indicates the proportion (%) of InDel markers. The CDS (coding sequences), URR (upstream regulatory region) and DRR (downstream regulatory region) of protein-coding genes were defined according to the available gene annotation of desi chickpea genome.14 This figure is available in black and white in print and in colour at DNA Research online.

