
Fig. 2.
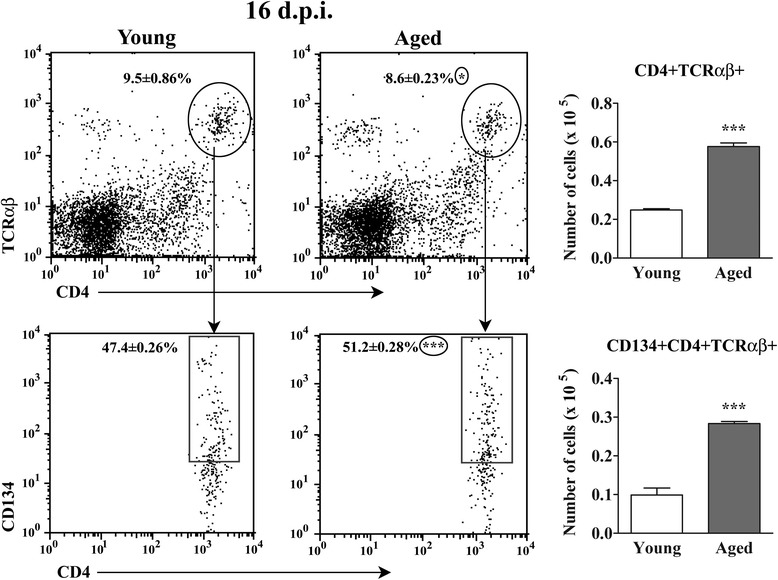
Aging increases the number of CD134 + CD4+ T cells in spinal cord of AO rats immunized for EAE. Lower flow cytometry dot plots show CD134 vs CD4 staining of lymphocytes retrieved from spinal cords of (left) young and (right) aged rats on the 16th d.p.i. CD4+ TCRαβ + cells were gated as shown in the upper flow cytometry dot plots. Numbers in the flow cytometry dot plots represent the percentage of (upper dot plots) CD4+ TCRαβ + cells within spinal cord cells and (lower dot plots) CD134+ cells among CD4+ TCRαβ + lymphocytes. Bar graphs show the number of (upper) CD4+ TCRαβ + cells and (lower) CD134 + CD4+ TCRαβ + cells in young and aged rat spinal cords. All results are presented as means ± SEM (n = 9/group). Data are representative of one of two experiments with similar results. *p < 0.05; ***p < 0.001