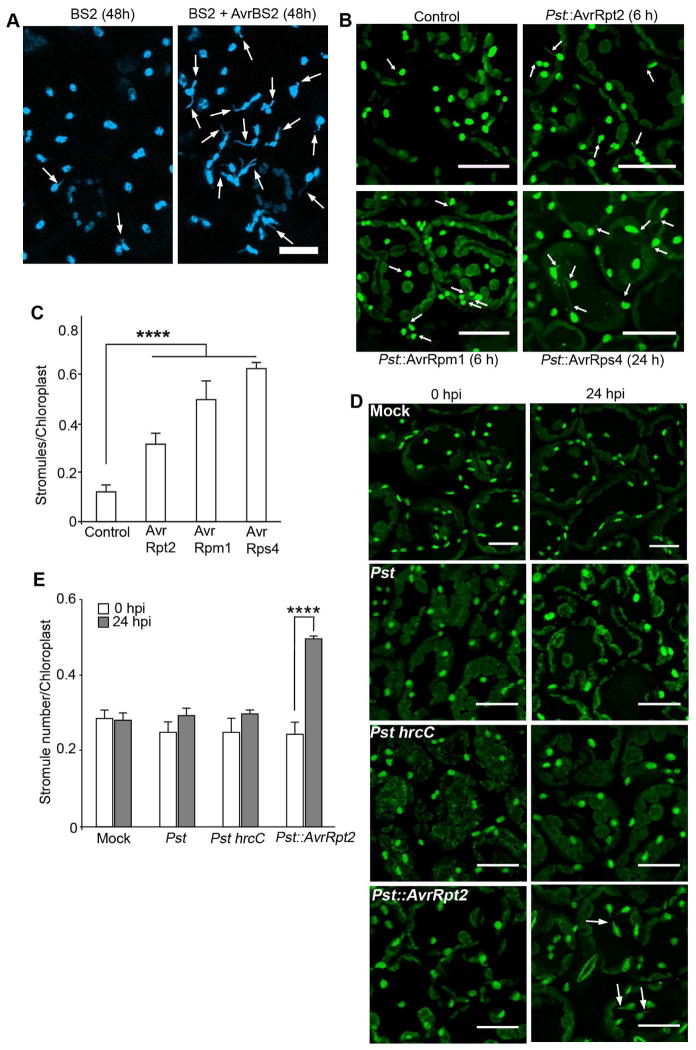
Figure 2. Stromule induction during bacterial immunity.
A. Stromules (arrows) were induced in transgenic NRIP1-Cerulean (blue) N. benthamiana plants after 48 h of transient coexpression of BS2 with AvrBS2 (right panel) compared to BS2 control (left panel). Scale bar equals 10 μm.
B. NRIP1-Cerulean (green) expressing transgenic Col-0 Arabidopsis plants were infiltrated with 1×10⁶ cfu/ml Pseudomonas syringae pv tomato DC3000 (Pst) expressing different effectors. Increased number of stromules (arrows) was observed in plants infected with Pst::AvrRpt2 for 6 h (top right panel), Pst::AvrRpm1 for 6 h (bottom left panel), and Pst::AvrRps4 for 24 h (bottom right panel) compared to the mock control (top left panel). Scale bar equals 25 μm.
C. Quantification of stromules from experiments described in B shows increased stromules in plant infected with Pst::AvrRpt2, Pst::AvrRpm1, and Pst::AvrRps4 compared to the mock control. Data represented as the mean ± SEM, ****P<0.001 (Student’s t-test).
D. Pst and Pst hrcC strains at 2.5×10⁵ cfu/ml were infiltrated onto NRIP1-Cerulean Arabidopsis plants (green). Stromules were not induced in plants infected with Pst or Pst hrcC or mock control (top 3 panels) compared to plants infected with Pst::AvrRpt2 (bottom right panel). Scale bar equals 20 μm.
E. Quantification of stromules from experiments described in D shows similar number of stromules in Pst and Pst hrcC infected plants to that of mock control. Pst::AvrRpt2 infection induced significant stromules. Data represented as the mean ± SEM, ****P<0.001 (Student’s t-test).

