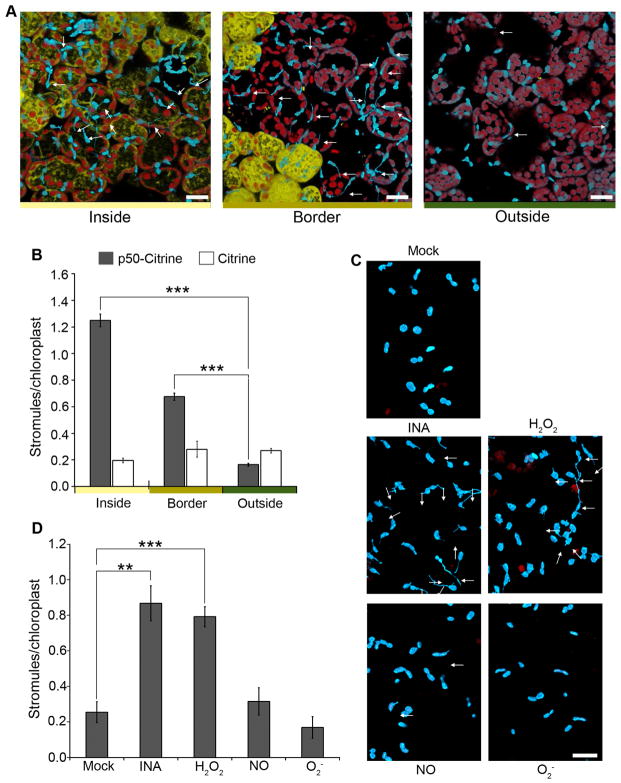
Figure 3. Stromules are induced at and along the border of HR-PCD and by exogenous application of H2O2 and SA.
A. The initial HR-PCD site was marked by transient expression of p50-Citrine (46 h; yellow). Citrine was used as a negative control. 46 h post-expression of p50-Citrine, strong stromule induction (arrows) was observed inside the HR-PCD site (left), a moderate stromule induction was observed along the border of the HR-PCD site (middle), and background amount stromules was observed away from the HR-PCD site (right). Scale bar equals 10 μm.
B. Quantification of stromules from experiments described in A shows strong induction of stromules inside the p50-Citrine induced HR-PCD site (gray bars), a moderate induction along the border and no induction outside HR-PCD site compared to the Citrine control (white bars).. Data represented as the mean ± SEM, ***P<0.005 (Student’s t-test).
C. Stromules (arrows) were induced in NRIP1-Cerulean N. benthamiana transgenic plants upon exogenous application of SA analog INA and H2O2 (middle panels) compared to NO donor SNAP, O2− generated by xanthine with xanthine oxidase (bottom panels), and mock buffer control (top panel) that did not cause stromule induction. Scale bar equals 10 μm.
D. Qunatification of stromules from experiments described in C shows increased stromule induction in INA or H2O2 treatments compared to NO, O2, or mock buffer control. Data represented as the mean ± SEM, **P<0.01, ***P<0.005 (Student’s t-test).

