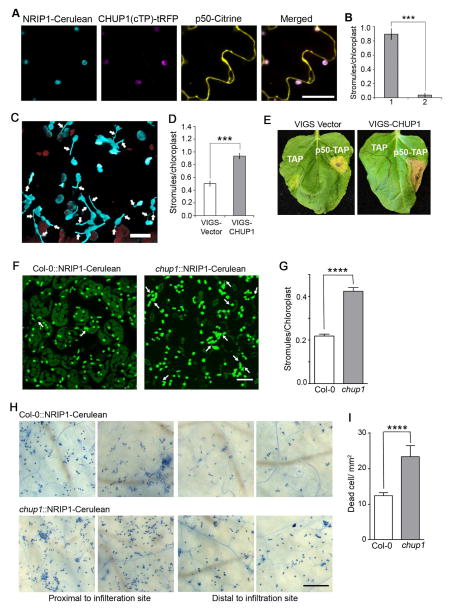
Figure 7. Constitutive induction of stromules enhances HR-PCD.
A. p50-Citrine (yellow, top right) and CHUP1(cTP)-tRFP (magenta, bottom left) were transiently coexpressed in NRIP1-Cerulean (blue, top left) transgenic N. benthamiana leaves. CHUP1(cTP)-tRFP colocalized with NRIP1-Cerulean in chloroplasts (merged) and completely disrupted p50-Citrine induced stromule formation. Scale bars equal 10 μm.
B. Stromules from experiment described in A were quantified from 2D maximum intensity projections of confocal microscopy z-stacks. Stromules were induced in plants expressing p50-Citrine (1) but significantly reduced in plants co-expressing p50-Citrine and CHUP1(cTP)-tRFP (2). Data represented as the mean ± SEM, ***P<0.005 (Student’s t-test).
C. Confocal micrograph showing that virus induced gene silencing (VIGS) of CHUP1 in N-containing plants induces stromules (arrows) constitutively. Scale bar equals 10 μm.
D. The number of stromules per chloroplast was higher in VIGS-CHUP1 plants compared to the VIGS-Vector control. Data represented as the mean ± SEM, ***P<0.005 (Student’s t-test).
E. After 3 days post p50-TAP expression, HR-PCD was observed as yellowing and limited brown, cellular collapse in the VIGS vector control. In the VIGS-CHUP1 plants, HR-PCD was accelerated as complete brown, cellular collapse. TAP was used as a negative control.
F. Constitutive induction of stromules (arrows) was observed in Arabidopsis chup1 knockout plants (right panel) compared to Col-0 wild type plants (left panel). Scale bar equals 20 μm.
G. Quantification of data from D shows increased stromules per chloroplast in chup1 plants compared to the Col-0 control. Data represented as the mean ± SEM, ****P<0.001 (Student’s t-test).
H. Col-0 (upper panels) and chup1 (bottom panels) plant leaves were infiltrated with 1X10⁶ Cfu/ml Pst::AvrRpt2 and stained with trypan blue 6 h post-infection. Two independent representative images of close to the infiltration site (left panels) and distal to the infiltration site (right panels) are shown. chup1 plants show increased cell death compared to the Col-0. Scale bar equals 0.5mm.
I. Quantification of dead cells in experiments described in F shows increased cell death in chup1 compared to Col-0. Data represented as the mean ± SEM, ****P<0.001 (Student’s t-test).

