Fig. 1.

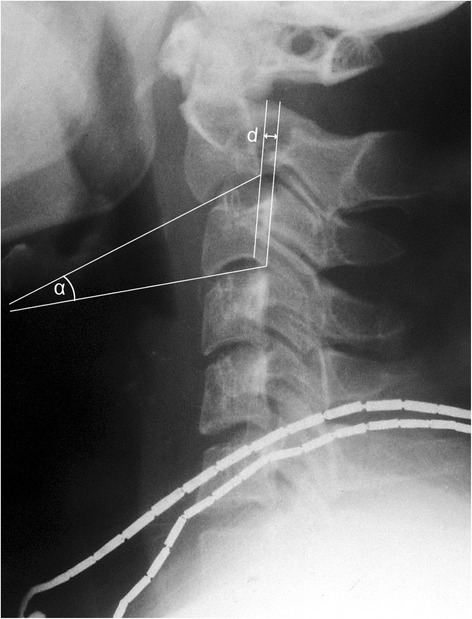
Diagram showing the local kyphotic angle and translation. α is the angle between inferior border of C2 and s C3. d is the distance between posterior boarders of C2 and C3

Diagram showing the local kyphotic angle and translation. α is the angle between inferior border of C2 and s C3. d is the distance between posterior boarders of C2 and C3