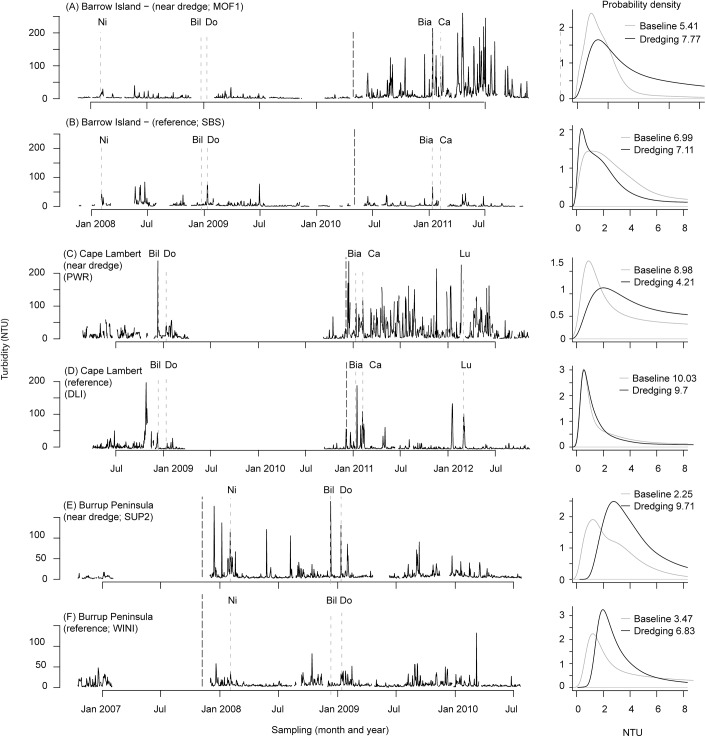
Fig 2. Instantaneous turbidity as maximum daily NTU (left column) and probability density function (far-right panels) at (A) MOF1 (B), SBS during the Barrow Island dredging project, (C) PWR and (D) DLI during the Cape Lambert dredging project, and (E) SUP2 and (F) WINI during the Burrup Peninsula project.
LNGI, PWR and SUP2 represent dredge impacted sites whereas SBS, DLI and WINI represent sites un-impacted by dredging (reference sites). The thick solid line on the left hand plots indicates the start of dredging for each project, whereas the dashed lines indicate the timing of cyclone events that may have had the potential to cause sustained periods of very rough seas in this region (Puotinen, pers comm) based on the cyclone size, intensity and proximity to sites (Beeden et al 2015). Annotations under each axis indicate each cyclone event, as follows: Nicholas (N), category 4; Billy (Bil), category 3; Dominic (Do), category 2; Bianca (Bia) category 4; Carlos (Ca), category 3; Lua (Lu) category 4. Cyclone categories indicate the intensity (Australian Ranking Scale) of each cyclone at closest approach to the sites. Time series and probability density function plots for all sites for the three projects can be found in the online supplementary information (Figures, A, B, C in S2 File).

