Fig. 5.

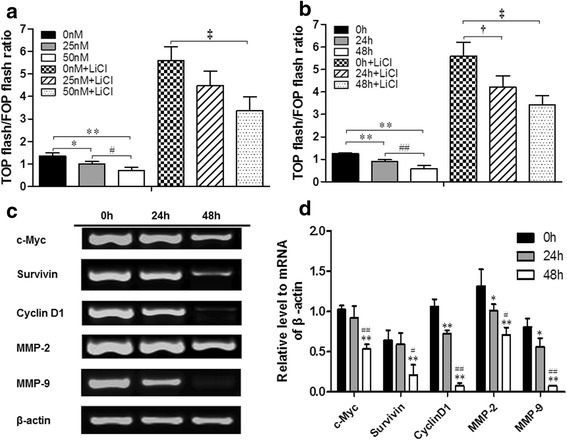
Changes in the Wnt/β-catenin signaling activities of U2OS and the mRNA expression levels of related downstream genes in this pathway. (a/b) With or without pretreatment with 20 μM LiCl, the TOP/FOP flash ratios were detected using a dual-luciferase assay in U2OS cells after treatment with 0, 25 and 50 nM of oleandrin for 24 h (a), or 50 nM of oleandrin for 0, 24 and 48 h (b), respectively. n = 3, Mean ± SD. * P < 0.05, ** P < 0.01, compared to the control group without LiCl in each intervention condition (0 nM group or 0 h group); # P < 0.05, ## P < 0.01, in the absence of LiCl, 25 nM group v.s. 50 nM group, 24 h group vs. 48 h group; † P < 0.05, ‡ P < 0.01, compared to the control group with LiCl in each intervention condition (0 nM group or 0 h group). c The gel electrophoresis of c-myc, survivin, cyclin D1, MMP-2, MMP-9 and β-actin after amplification. d The semi-quantitative relationship between the mRNA expression levels of related target genes and β-actin in U2OS cells according to the results of gel electrophoresis in RT-PCR after treatment with 50 nM of oleandrin for 0, 24 and 48 h. * P < 0.05, ** P < 0.01, compared to the 0 h group. # P < 0.05, ## P < 0.01, compared to the 24 h group
