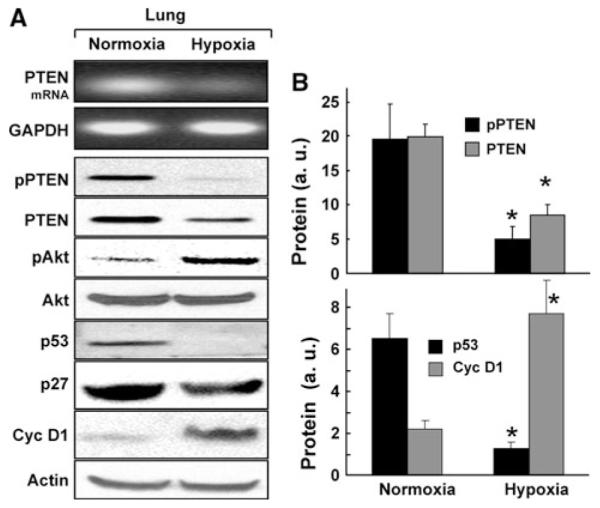
Fig. 6.

Expression of PTEN and related downstream proteins in the hypoxia model of PH. Rats were continuously exposed to 10% oxygen (hypoxia) for 3 weeks to induce PH. Reverse Transcription-PCR and western-blot analysis were performed on lung tissues. a Representative RT-PCR and western blot images of PTEN and related proteins. The RT-PCR image shows a decrease in PTEN expression at the mRNA level. Western-blot images show decreases in PTEN, pPTEN, and p53, and increase in pAkt and cyclin-D1 protein levels. b Quantitative results of the blots. Data represent mean ± SEM (n = 8). *P < 0.05 versus respective normoxic control. Significant decreases in both PTEN and pPTEN was observed when compared with the normoxic controls. The results also show a significant downregulation of p53 and upregulation of cyclin-D1 in the PH tissues
