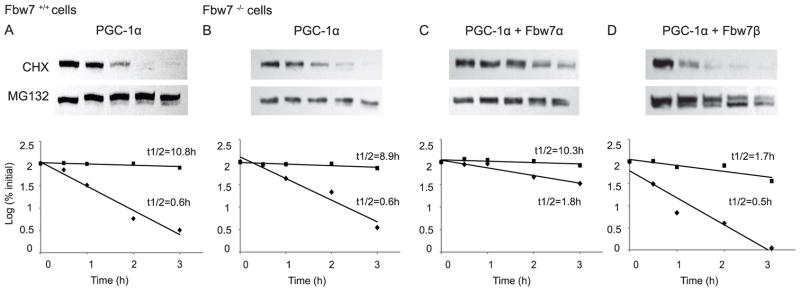
FIGURE 2. Fbw7 isoform specific impact on PGC-1α degradation rate.

18h after transfection with the indicated plasmids, Fbw+/+ (A) or Fbw7−/− (B, C, D) cells were treated with CHX +/− MG132. Cells were thereafter lysed at 0, 0.5, 1, 2, and 3h and were evaluated for PGC-1α degradation via SDS-PAGE, Western blotting for PGC-1α. The pixels for each band were measured and normalized so that the number of pixels at t=0 was 100%. The log10 of the percent of pixels was plotted versus time for each time point and the t½ was calculated from the log of 50%.
