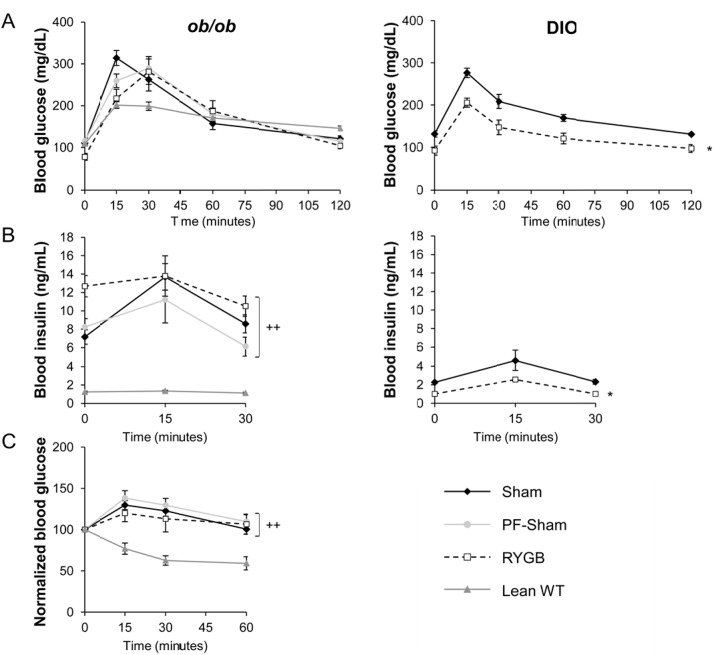
Fig 4. RYGB fails to improve glucose and insulin tolerance as well as glucose-stimulated plasma insulin in ob/ob mice.
(A, left) Glucose tolerance (B, Left) Glucose-stimulated plasma insulin and (C) insulin tolerance in sham, PF-sham, and RYGB-treated ob/ob mice. Non-operated, age-matched, lean C57BL/6 mice (Lean WT) are presented as control for insulin sensitivity. Data from sham and RYGB DIO mice are shown in panels (A, Right) and (B, Right) as controls for the effects of surgery on glucose homeostasis. (ob/ob: n = 21, sham; n = 7, PF-sham, n = 13–15, RYGB | Lean WT: n = 6–12 | DIO: n = 5–7 sham, n = 6–8, RYGB). Results are presented as mean ± SEM. Curves were analyzed using area-under-the-curve analysis. ++ p < .05 vs lean assessed using 1-Way ANOVA for ob/ob mice and * p < .05 vs sham assessed using Student’s t-test for DIO mice.

