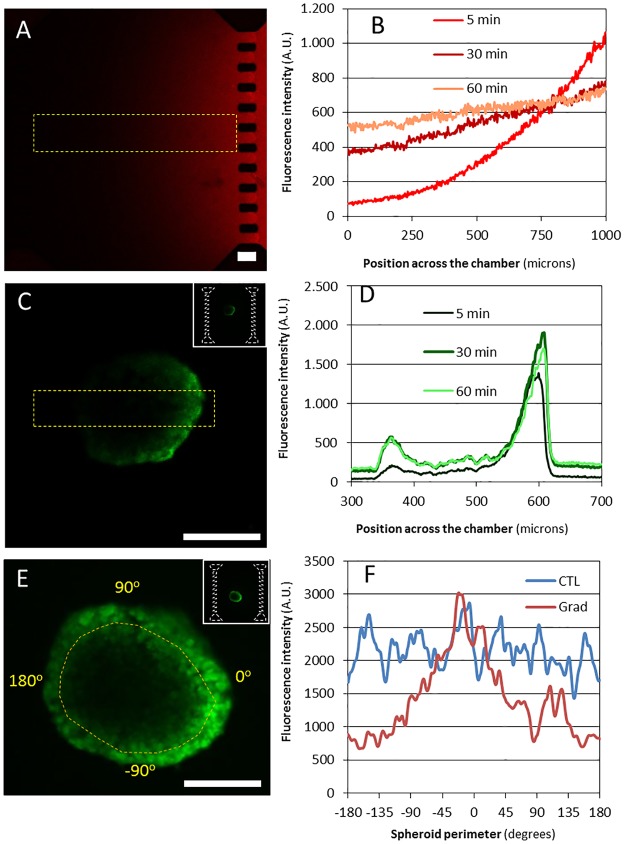
Fig 2. Chemical gradient across the microchamber.
(A) A complete image of the microchamber 5 minutes after red fluorescent Rhodamine B was perfused through the right lateral microchannel. (B) Evolution of fluorescence intensity of Rhodamine B along the whole microchamber width (as highlighted in yellow in A) over time. (C) An image of an OSC–19 spheroid after 5 minutes of FDA perfusion through the right lateral microchannel. (D) Fluorescence intensity along the section of the spheroid (as highlighted in yellow in B) after 5 minutes of FDA perfusion. (E) Fluorescence intensity within the spheroid after 1 hour of FDA perfusion. (F) Fluorescence intensity along the spheroid perimeter after 1 hour of FDA perfusion through only one lateral microchannel (gradient condition-blue line) or through the hydrogel (control condition-red line). Images corresponding with the spheroid middle focal plane are shown. Scale bar is 100 μm.

