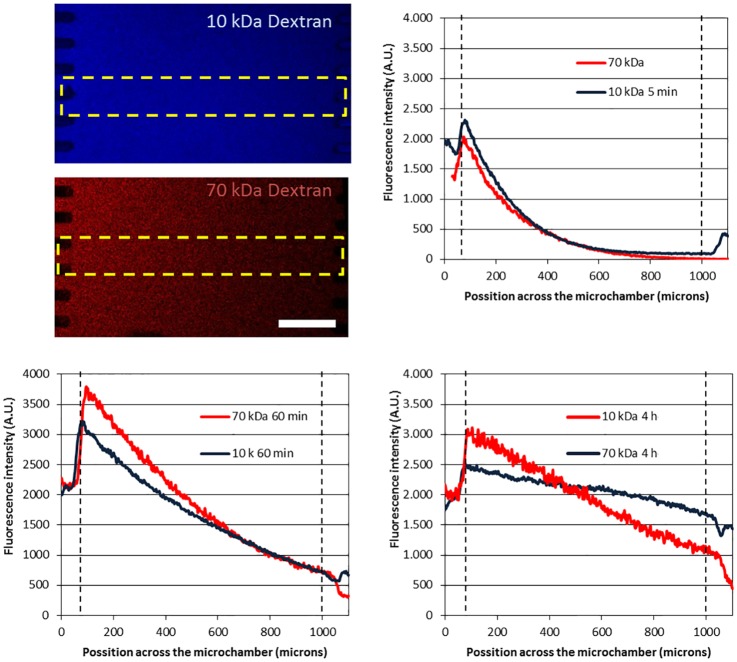
Fig 3. Influence of molecule size on diffusion profile.
(A) Cascade blue–10 kDa and TRITC–70 kDa dextran at 10 μM were injected in the left microchannel and confocal images are shown after 4 hours. Fluorescent 10 kDa and 40 kDa diffusion profile is compared at 5 min (B), 60 min (C) and 4 hours (D) post-injection.

