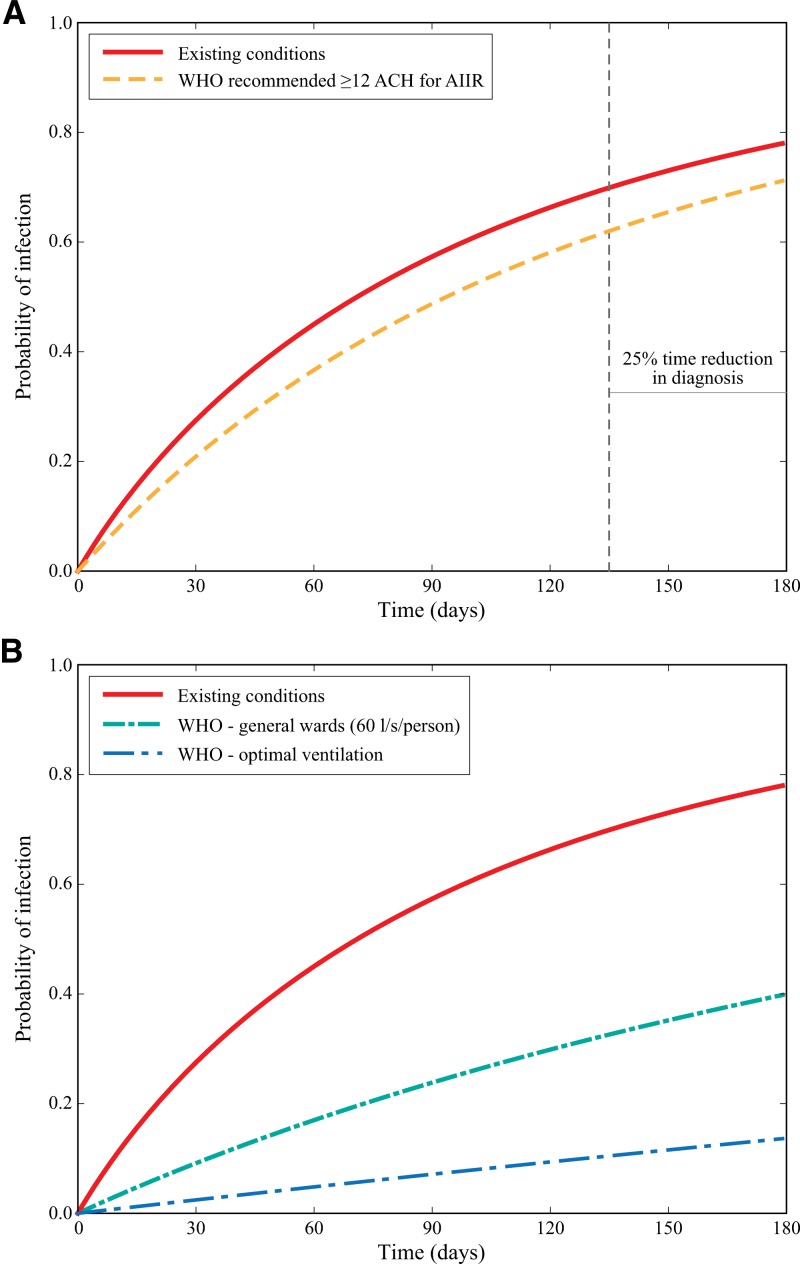
Figure 3.
The effects of improving cell ventilation and time-to-diagnosis on tuberculosis (TB) transmission probabilities by the time of infectiousness up to 180 days. Two values of ventilation scenarios are shown (A): the current estimated mean absolute ventilation (m3/hour) and the mean of improving ventilation in all cells to ≥12 air changes per hour (ACH) as recommended for airborne infection isolation rooms (AIIR). The vertical dashed line represents a 25% reduction in time to diagnosis. Three values of ventilation scenarios are shown (B): the current estimated mean absolute ventilation (m3/hour); improved ventilation rate in all cells to 60 L/s/person; and improved ventilation rate in all cells to reflect ACH under a cross-ventilation design for naturally ventilated settings.

