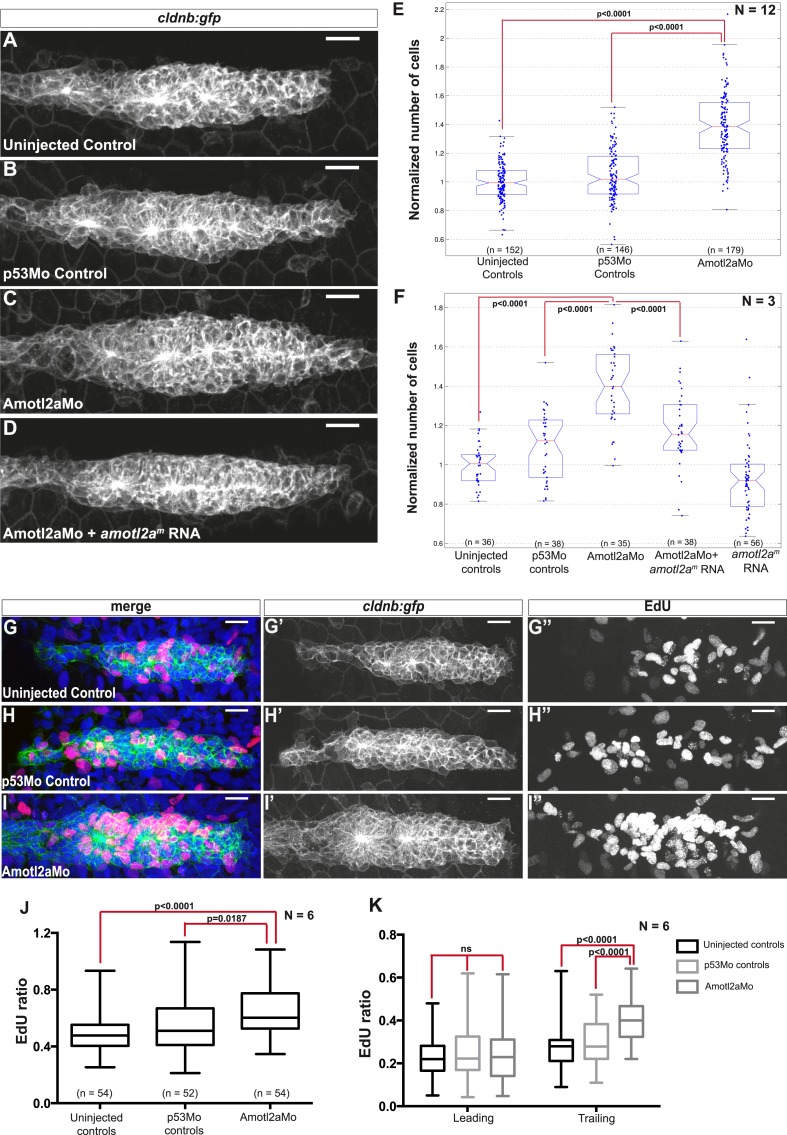
Figure 3. Amotl2a is required to limit proliferation in the pLLP.
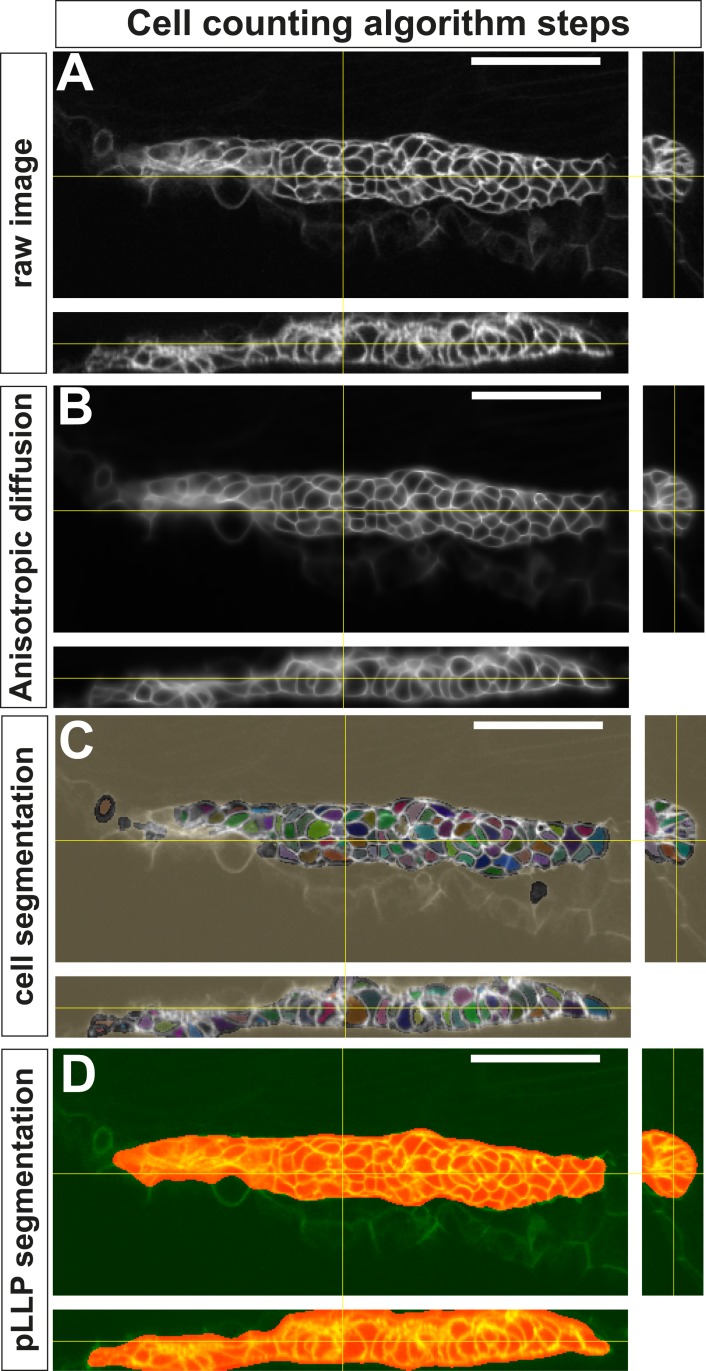
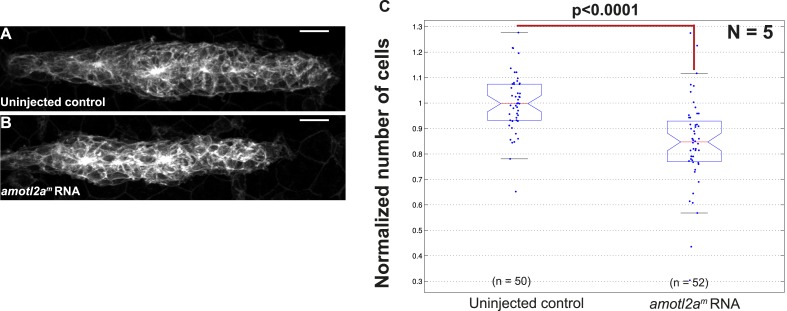
(A–D) MIP of Z-stacks of pLLP in cldnb:gfp embryos injected as indicated. (E, F) Boxplots showing the number of cells in the primordia of indicated groups, normalized to the control group. (G–I′′) MIP of Z-stacks of pLLP in cldnb:gfp embryos stained with EdU and DAPI showing the green (membranes, middle), red (EdU, right), and merge (left) channels. (J, K) Boxplot showing the comparison of the EdU index in the indicated experimental conditions in whole primordia (J) or separately in the leading and trailing region (K) (Figure 3—source data 1–3, Figure 3—figure supplements 1, 2, Figure 3—source data 4).
DOI: http://dx.doi.org/10.7554/eLife.08201.010


