. 2015 Sep 3;4:e08201. doi: 10.7554/eLife.08201

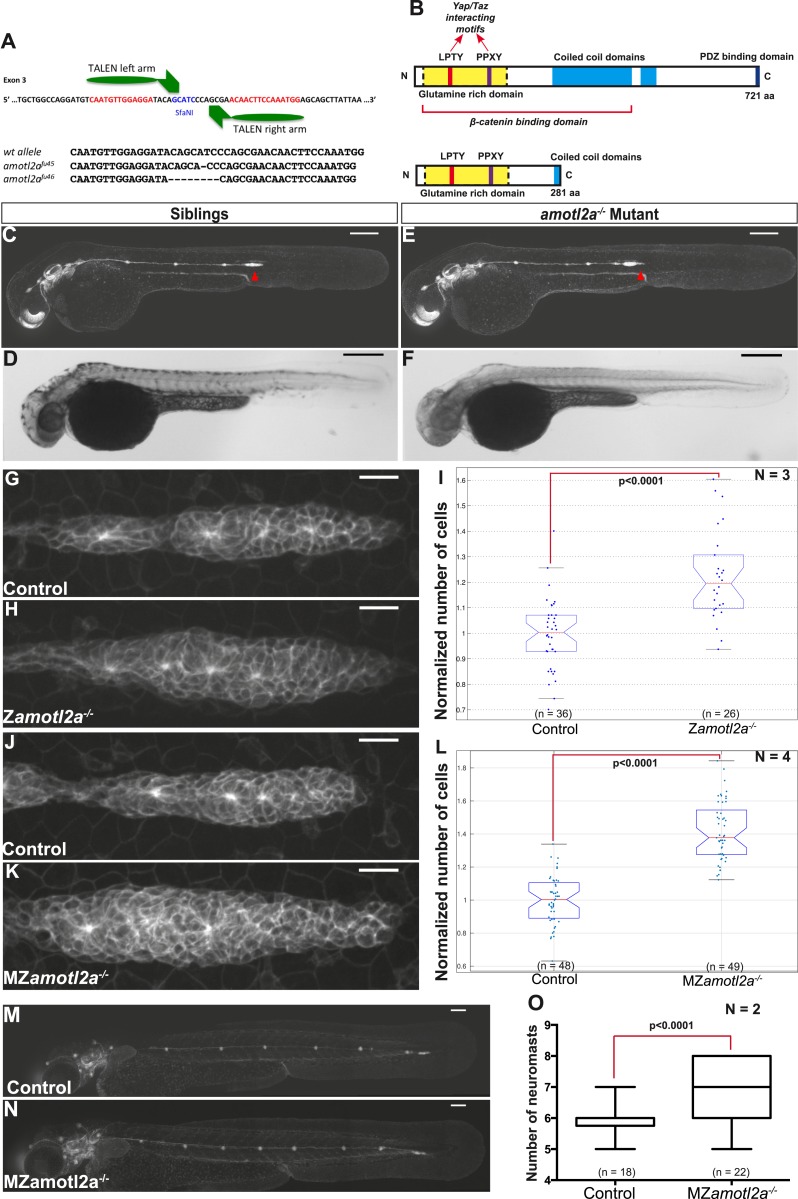
Figure 4. amotl2a mutants phenocopy the morphant phenotype.

(A) Scheme showing the transcription activator-like effector nuclease (TALEN) target site in the amotl2a locus with the left and right TALEN-binding sites in red separated by the spacer including the restriction site used for screening (blue) (top). Alignment of the two conserved amotl2a mutant alleles with the corresponding wild-type sequence showing the deleted nucleotides (bottom). (B) Scheme comparing the functional domains present in the wild-type Amotl2a protein (721aa long) and the putative truncated proteins (272aa +17 or +9 missense aa for allele fu45 and fu46, respectively). (CF) 36 hpf cldnb:gfp wild-type sibling (C, D) or amotl2a−/− mutant embryo (E, F) imaged with fluorescent (C, E) or transmitted light (D, F). (G, H, J, K) MIP of Z-stacks of pLLP in cldnb:gfp embryos with the indicated genetic background. (I, L) Boxplots comparing the cell numbers between the indicated genetic backgrounds. (M, N) MZamotl2a−/− mutant embryo (N) showing an extra deposited neuromast as compared to a wild-type sibling embryo (M). (O) Boxplot showing the corresponding quantification (Figure 4—source data 1, 2; Figure 4—figure supplements 1, 2, Figure 4—source data 3, 4).

DOI: http://dx.doi.org/10.7554/eLife.08201.017

Figure 4—source data 1. Cell counts in zygotic amotl2a mutants.
elife08201s007.xlsx (46.3KB, xlsx)
DOI: 10.7554/eLife.08201.018
Figure 4—source data 2. Number of deposited neuromasts in MZamotl2a mutants.
elife08201s008.xlsx (35KB, xlsx)
DOI: 10.7554/eLife.08201.019
Figure 4—source data 3. Migration speed in MZamotl2a mutants.
elife08201s009.xlsx (36KB, xlsx)
DOI: 10.7554/eLife.08201.020
Figure 4—source data 4. Cell counts in neuromasts of morphants (Excel sheet 1 related to panel A) and MZamotl2a mutants (Excel sheet 2 related to panel B).
elife08201s010.xlsx (36.5KB, xlsx)
DOI: 10.7554/eLife.08201.021

Figure 4.

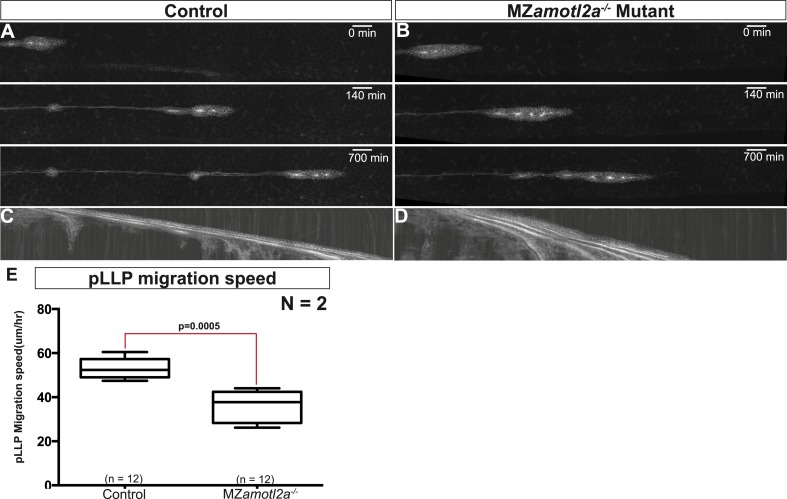
Figure 4—figure supplement 1. MZamotl2a−/− mutants exhibit reduced pLLP migration speed.

Figure 4—figure supplement 1.

(A, B) Snapshots of time-lapse movies at the indicated timepoint showing a delay in migration speed in MZamotl2a−/− mutants (B) as compared to siblings (A). (C, D) Corresponding kymographs. (E) Boxplot comparing the migration speeds in control vs MZamotl2a−/− mutant pLLP (Figure 4—source data 3).
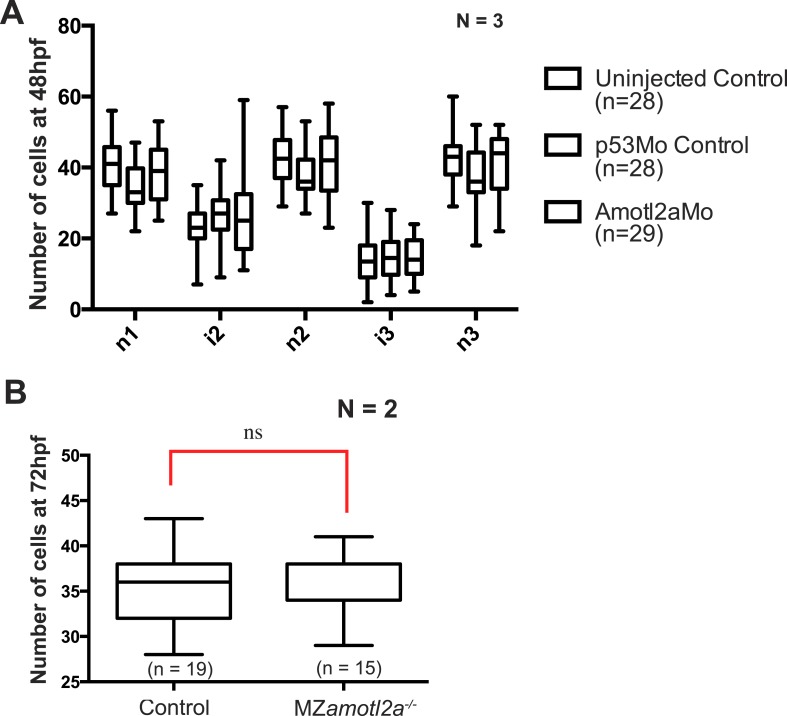
Figure 4—figure supplement 2. Deposited neuromasts or interneuromast chains do not contain more cells in amotl2a morphants or mutants.

Figure 4—figure supplement 2.

(A) Boxplots showing cell number quantifications in the first 3 neuromasts (n1 to n3) and interneuromast regions (i1 and i2) at 48 hpf in the indicated experimental conditions. (B) Boxplot showing cell number quantification in one neuromast close to the end of yolk extension (n3 or n4) at 72 hpf in the indicated experimental conditions (Figure 4—source data 4).