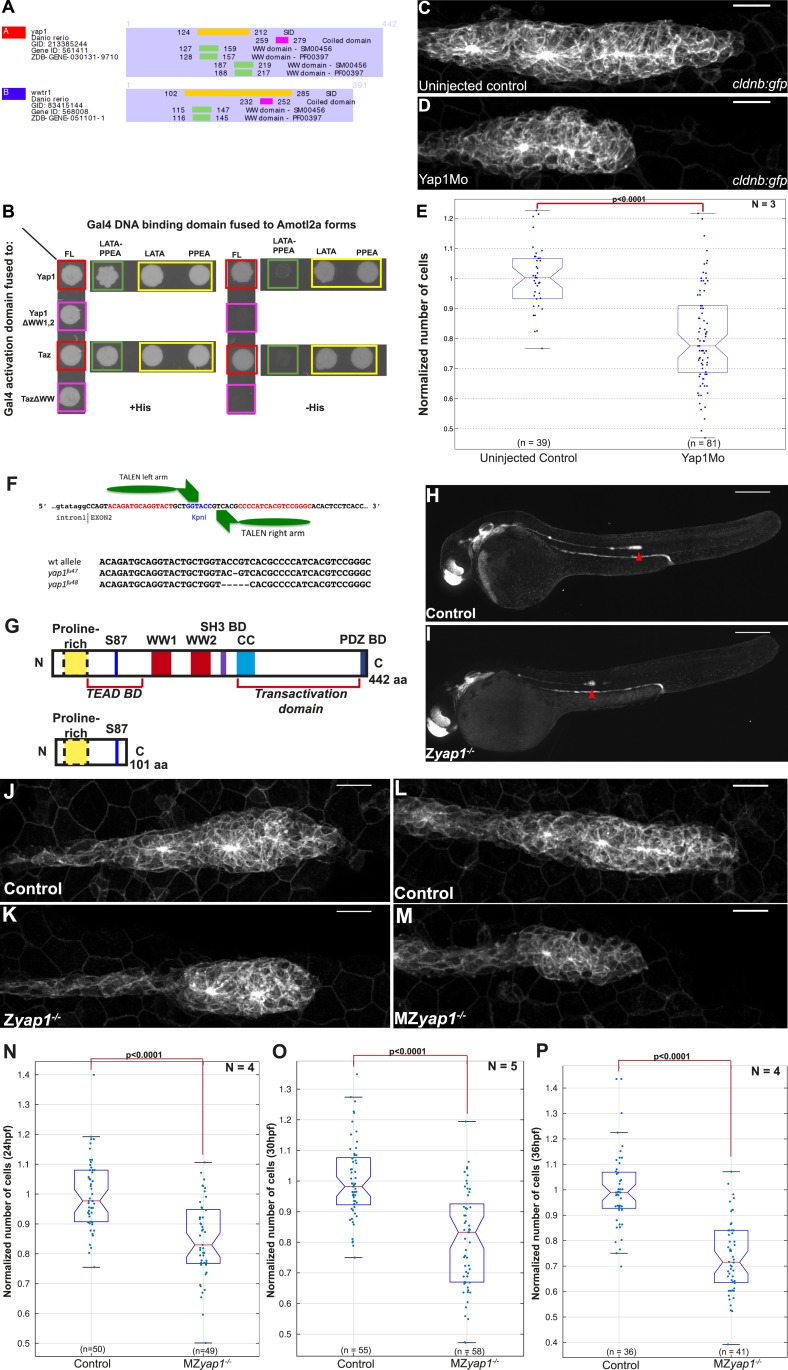
Figure 5. Yap1 physically interacts with Amotl2a and is required for the pLLP to have the correct number of cells.
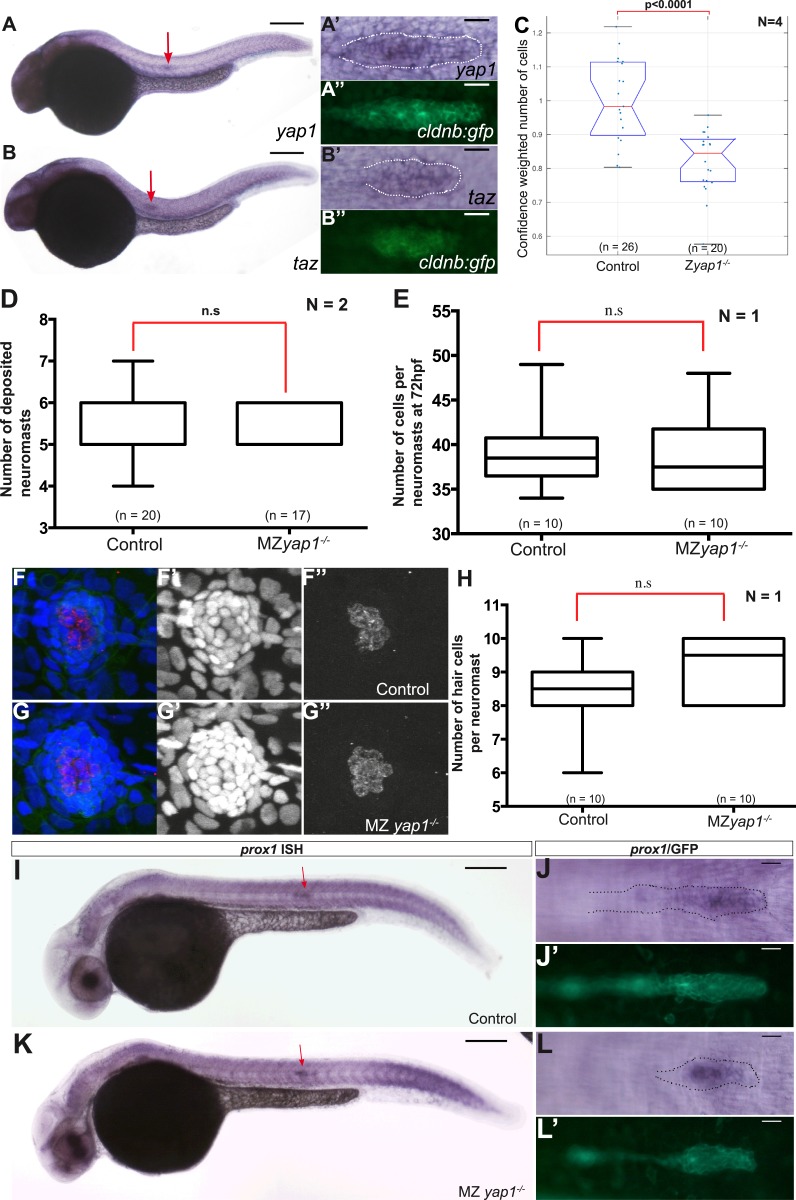
(A) Part of the yeast two-hybrid (Y2H) screen results showing the Selected Interaction Domain (SID) of Yap1 and Taz (encoded by the gene wwtr1) and known functional and structural domain on these proteins. The SID is the amino acid sequence shared by all prey fragments matching the same reference protein, here Yap1 and Taz. (B) Y2H assay with Histidine (left panel, growth control) and without Histidine (right panel, protein interaction assay) showing the interactions between zebrafish Amotl2a and Yap1 or Taz (red), but not with the corresponding proteins mutated in the known interaction motifs: LPTY/PPEY for Amotl2a (green) and WW domain for Yap1 and Taz (pink). (C, D) MIP of Z-stacks of pLLP in cldnb:gfp embryos injected as indicated. (E) Boxplot comparing the number of cells in the pLLP in Yap1Mo-injected embryos and controls. (F) Scheme showing the TALEN target site in the yap1 locus with the left and right TALEN-binding sites in red separated by the spacer including the restriction site used for screening (blue) (top). Alignment of the two yap1 mutant alleles with the corresponding wild-type sequence showing the deleted nucleotides (bottom). (G) Scheme comparing the functional domains present in the wild-type Yap1 (442aa long) and the putative truncated proteins (76aa +25 or +45 missense aa before for allele fu47 and fu48, respectively). (H, I) Overview pictures of 36 hpf cldnb:gfp control and Zyap1−/− embryos. (J–M) MIP of Z-stacks of pLLP in cldnb:gfp embryos with the indicated genotype. (N–P) Boxplot showing cell counts in the pLLP in embryos of the corresponding genotypes (Figure 5—source data 1, 2; Figure 5—figure supplement 1; Figure 5—source data 3, 4).
DOI: http://dx.doi.org/10.7554/eLife.08201.024


