. 2015 Sep 3;4:e08201. doi: 10.7554/eLife.08201

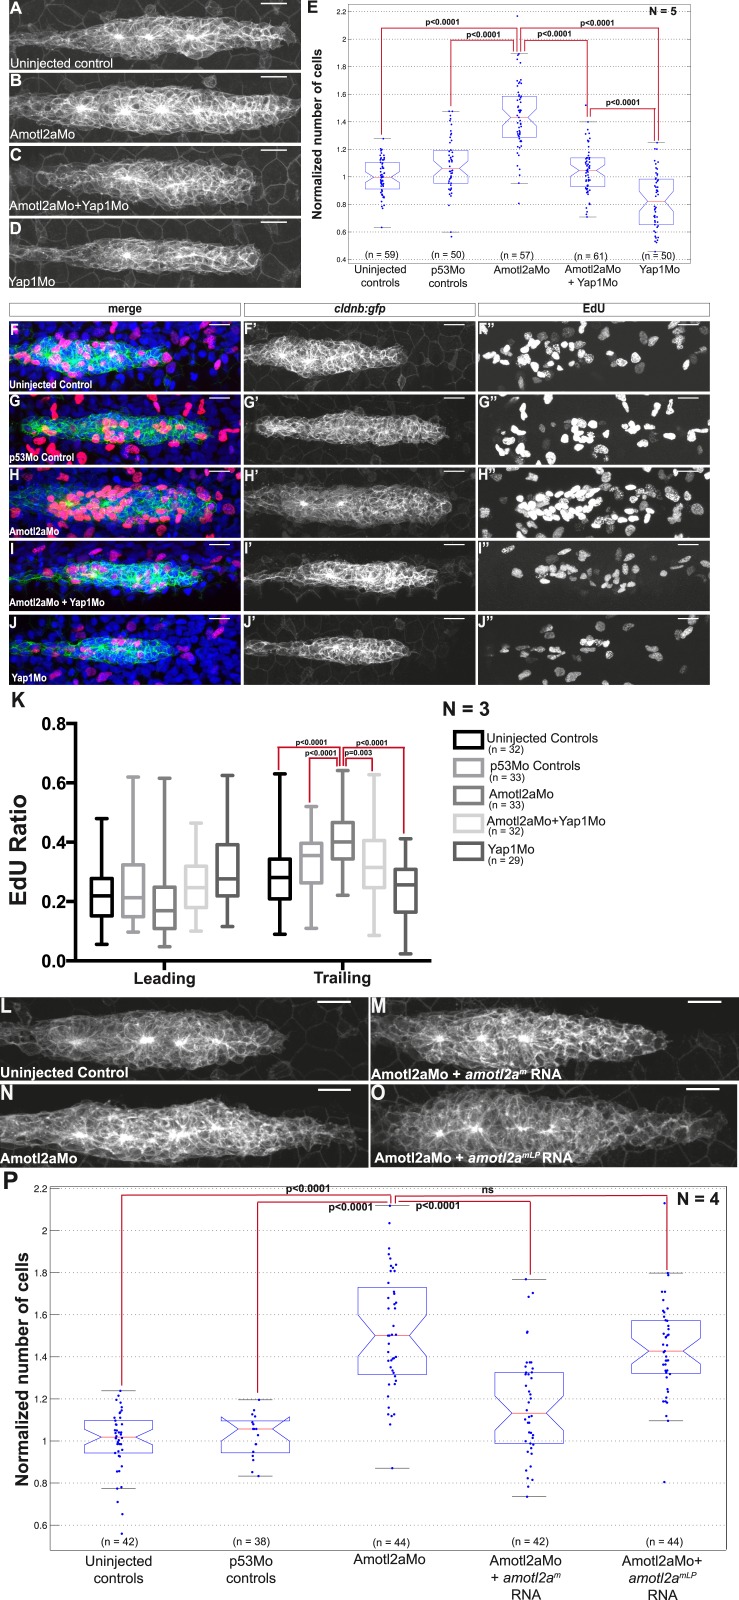
Figure 6. Loss of Yap1 suppresses the increased cell proliferation in amotl2a morphant.

(AD, LO) MIP of Z-stacks of pLLP in cldnb:gfp embryos injected as indicated. (E, P) Corresponding boxplots comparing pLLP cell counts. (FJ′′) MIP of Z-stacks of pLLP in cldnb:gfp embryos stained with EdU and DAPI showing the EdU (right panels), cell membranes (middle panels), and merged channels (left panels). (K) Corresponding boxplot showing the EdU index in the leading and trailing regions of the pLLP in the indicated experimental conditions (Figure 6—source data 1–3; Figure 6—figure supplement 1, Figure 6—source data 4).

DOI: http://dx.doi.org/10.7554/eLife.08201.030

Figure 6—source data 1. Cell counts in amotl2a;yap1 double morphants.
elife08201s015.xlsx (37.9KB, xlsx)
DOI: 10.7554/eLife.08201.031
Figure 6—source data 2. EdU ratio in the leading region and trailing region of amotl2a;yap1 double morphants.
elife08201s016.xlsx (52KB, xlsx)
DOI: 10.7554/eLife.08201.032
Figure 6—source data 3. Cell counts in embryos co-injected with Amotl2aMo and amotl2am or with Amotl2aMo and amotl2amLP.
elife08201s017.xlsx (39.5KB, xlsx)
DOI: 10.7554/eLife.08201.033
Figure 6—source data 4. Cell counts in MZamotl2a;MZyap1 double mutants.
elife08201s018.xlsx (39.7KB, xlsx)
DOI: 10.7554/eLife.08201.034

Figure 6.

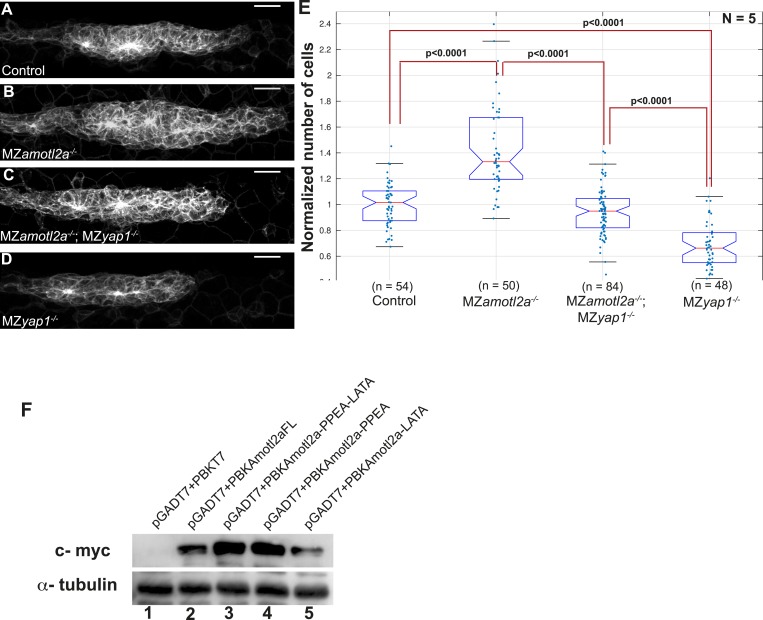
Figure 6—figure supplement 1. Loss of Yap1 in MZamotl2a−/−;MZyap1−/− embryos supresses increased pLLP cell number resulting from loss of Amotl2a in MZamotl2a-−/− embryos.

Figure 6—figure supplement 1.

The mutation of Yap1-binding domains in Amotl2a does not render it unstable. MIP of Z-stacks of pLLP in cldnb:gfp embryos with the indicated genotype (AD). (E) Corresponding boxplot comparing pLLP cell counts. (F) Western blot showing the stability of wild-type Amotl2a, Amotl2aFL (lane2) and Amotl2a forms carrying both PPEA-LATA (lane3) and single PPEA and LATA (lanes 4 and 5), respectively. α-tubulin staining shows equal protein loading (Figure 6—source data 4).