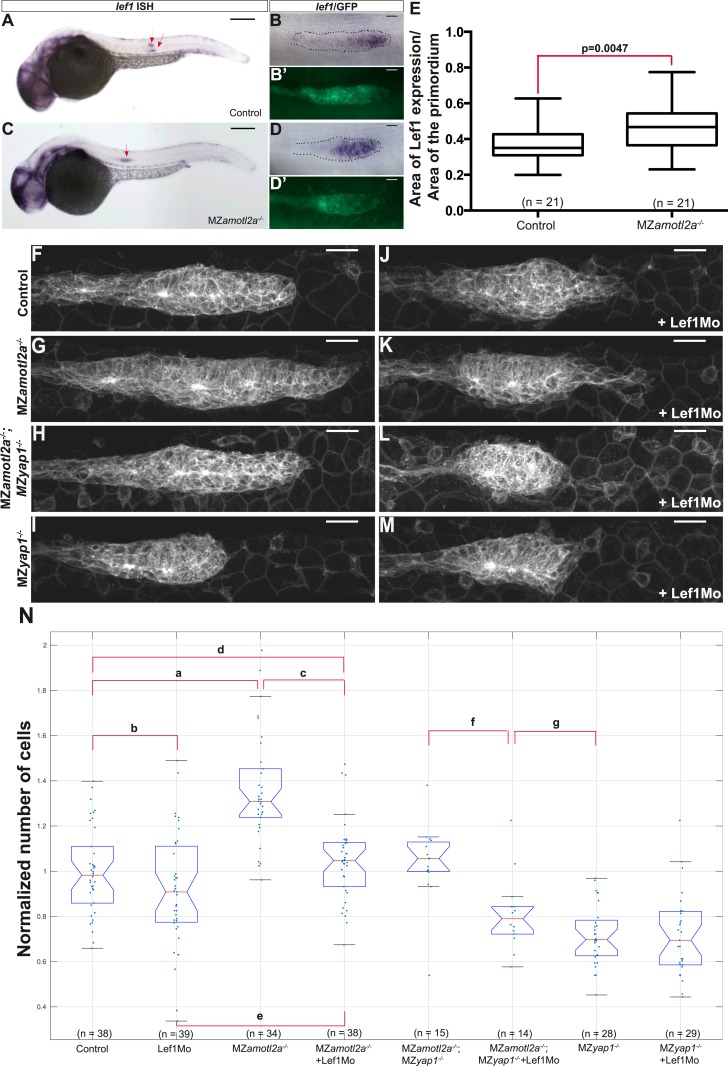
Figure 7. Loss of Lef1 suppresses the increased cell proliferation in amotl2a mutants.
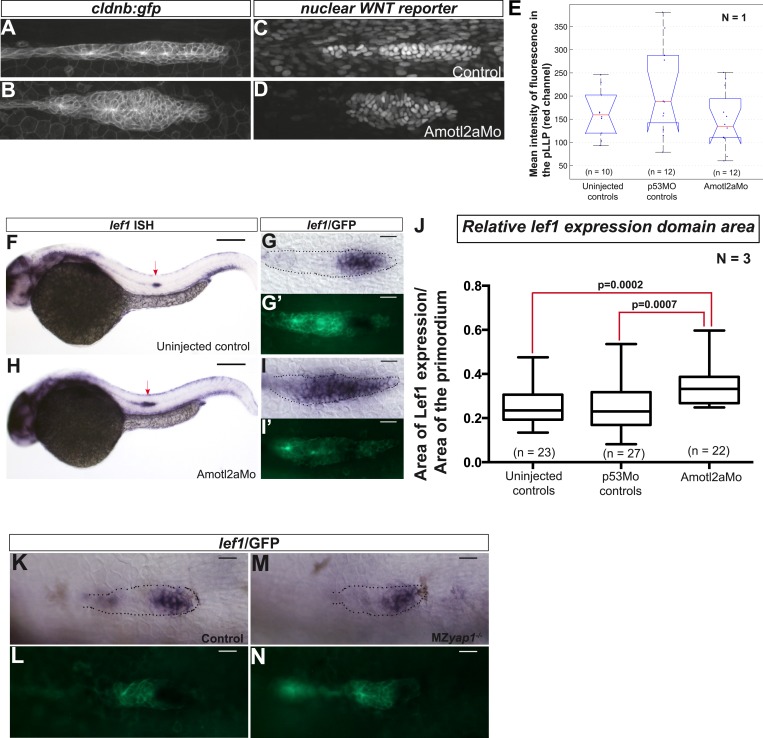
(A–D′) 30 hpf cldnb:gfp embryos with the indicated genetic background stained with a lef1 ISH probe and an anti-GFP antibody (B′, D′). (E) Boxplot showing the expansion of lef1 expression domain in MZamotl2a−/− embryos. (F–M) MIP of Z-stacks of pLLP in cldnb:gfp embryos with the indicated genotype, either uninjected (F–I) or injected with a Lef1Mo (J–M). (N) Corresponding boxplot comparing pLLP cell counts (Figure 7—source data 1, 2; Figure 7—figure supplement 1, Figure 7—source data 3).
DOI: http://dx.doi.org/10.7554/eLife.08201.036


