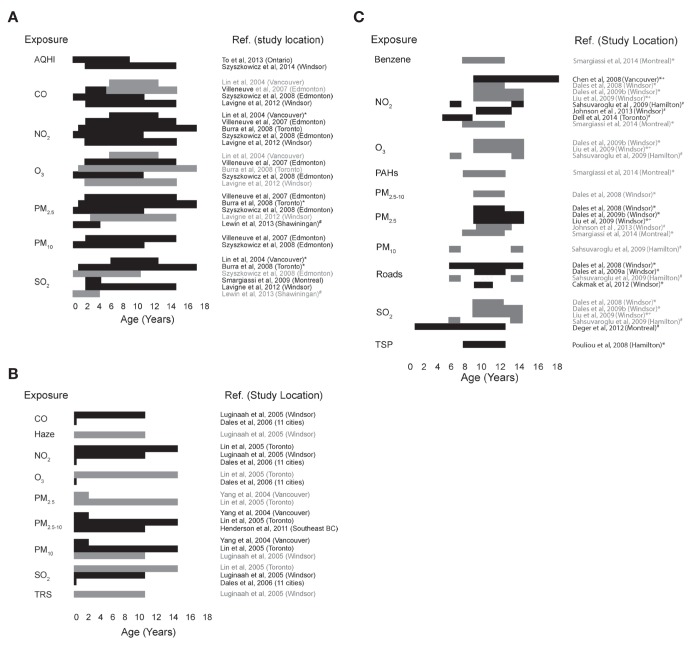
Figure 3).
Respiratory health outcomes according to air pollutant and children’s age range. The age groups of children tested by each reference were plotted for each air pollutant measure tested. Bars indicate either a statistically significant (P<0.05, black) or nonsignificant (P>0.05, grey) association between the indicated pollutant and the health effect, for each age group studied by the indicated study. A The incidence of emergency department (ED) visits and hospitalizations for asthmatic symptoms and pollution exposure. *Effect was present or stronger in populations with low socioeconomic status. #ED visits and hospitalizations for bronchiolitis were also included as relevant health outcomes in the study. B Associations between pollution exposure and health services use for conditions other than asthma. C Lung function measurements and symptoms of affected lung function (eg, wheezing and other asthma-like symptoms) were tested for associations with differing levels of pollutant exposure. *Lung function was measured; +Lung inflammation was measured;#Asthmatic symptoms were measured. AQHI Air Quality Health Index; CO Carbon monoxide; NO2 Nitrogen dioxide; O3 Ozone; PAHs Polycyclic aromatic hydrocarbons; PM2.5/PM10 Particulate matter size ≤2.5 μm/≤10 μm in aerodynamic diameter; SO2 Sulphur dioxide; TRS Total reduced sulphur; TSP Total suspended particles

