Figure 1.
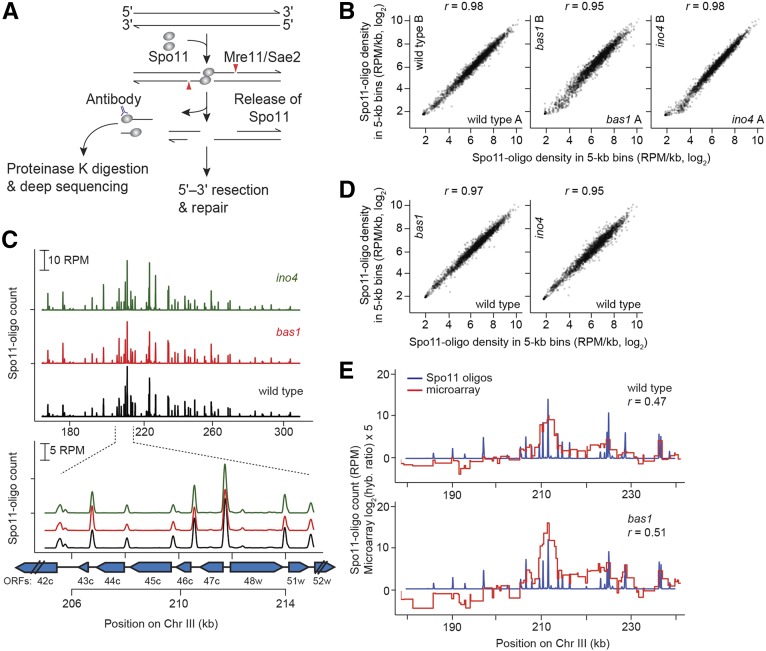
Spo11-oligo mapping in bas1 and ino4 mutants. (A) Formation and processing of meiotic DSBs (Spo11-oligo mapping method on left). (B) Quantitative reproducibility of Spo11-oligo maps. Comparisons are shown for individual wild-type, bas1, or ino4 datasets. Spo11 oligos were summed in nonoverlaping 5-kb bins and expressed as RPM per kilobase (plotted on a log scale). Correlation coefficients (Pearson’s r) are shown on the top. (C) Top, bas1 and ino4 mutations do not cause widespread change in the large-scale patterns of the DSB landscape. Bottom, DSBs form at the same hotspots in bas1 and ino4 as in wild type. Spo11-oligo counts here and in E are the per-base pair frequency, smoothed with a 201-bp Hann window. Positions of open reading frames are indicated by blue arrows. (D) Comparison between wild-type and TF mutant datasets. For each genotype, Spo11-oligo maps were averaged from biological replicates. (E) The Spo11-oligo map agrees with previous rad50S Spo11 ChIP microarray analysis (Mieczkowski et al. 2006) but provides higher resolution. A representative genomic region is shown. The value for each microarry probe is plotted along the length of sequence covered by the probe. The correlation coefficient was calculated between the normalized microarray signal and the sum of Spo11-oligo counts within 2 kb on either side of each microarray probe.

