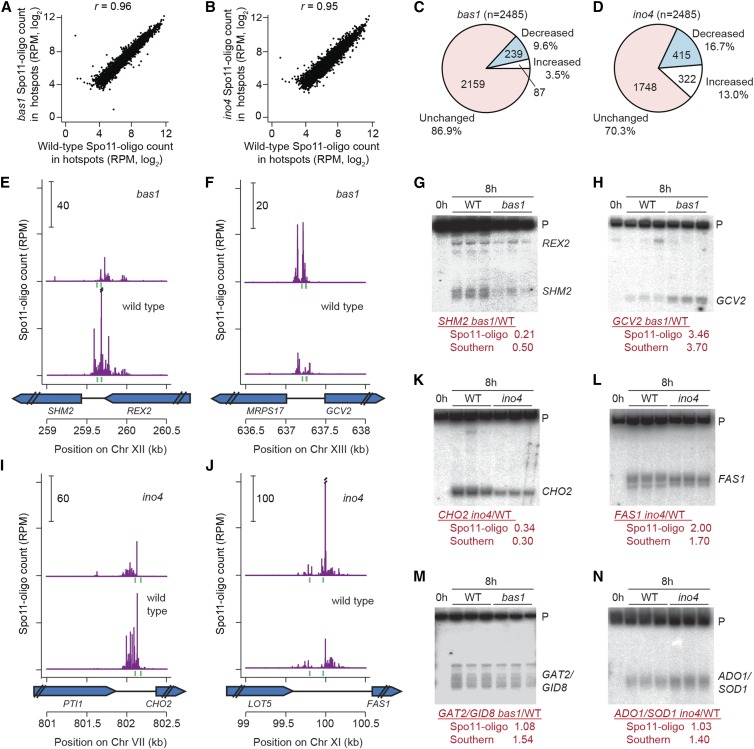
Figure 2.
Effects of bas1 and ino4 mutations on DSB activity at individual hotspots. (A and B) Comparisons between wild type and TF mutants for all hotspots. (C and D) Proportion of hotspots that displayed at least a 20% change in Spo11-oligo counts relative to wild type. (E, F, I, and J) Spo11 oligos in hotspots at the promoters of SHM2 (E), GCV2 (F), CHO2 (I), and FAS1 (J). Double slashes indicate where Spo11-oligo counts are off scale. Green vertical ticks indicate sequence matches to Bas1 (E and F) or Ino4 (I and J) binding motifs. (G, H, and K–N) Southern blot results confirming the Spo11-oligo data for hotspots at the promoters of SHM2 (G), GCV2 (H), CHO2 (K), FAS1 (L), GAT2–GID8 (M), and ADO1–SOD1 (N). Genomic DNA was purified from three independent 8-hr sae2Δ cultures for each genotype and analyzed by Southern blotting and indirect end labeling. Fold change (mutant/wild type) for each hotspot is shown below the blots. P, parental.

