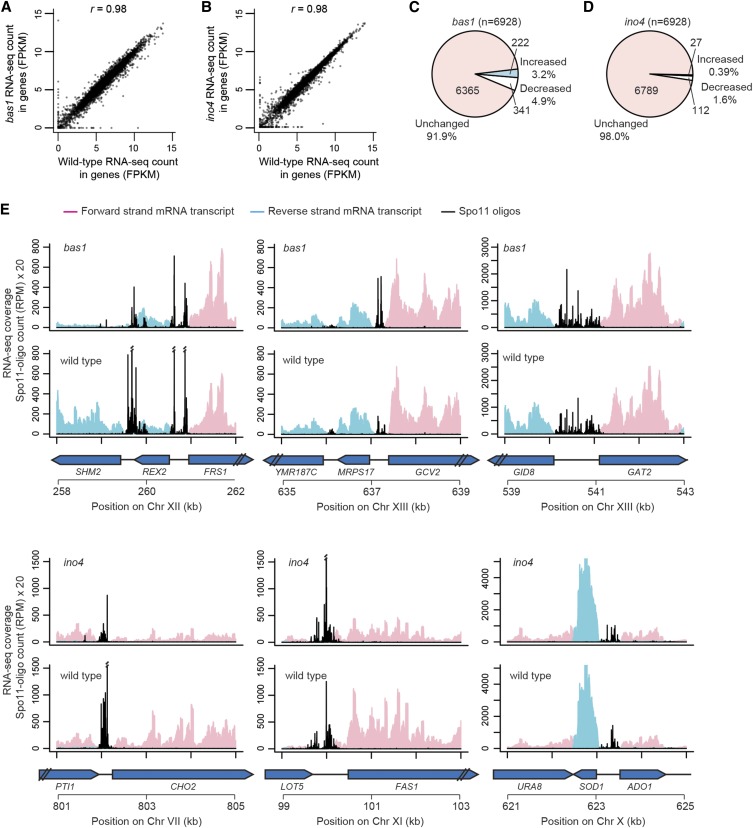
Figure 7.
mRNA levels in bas1 and ino4 mutants. (A and B) Comparisons of RNA-seq read counts (in fragments per kilobase per million mapped reads, FPKM, log2-transformed) between wild type and TF mutants for all annotated genes. (C and D) Proportion of genes that were significantly changed relative to wild type (false discovery rate q < 0.05). (E) Snapshots of RNA-seq data around hotspots at the promoters of SHM2, GCV2, GAT2–GID8, CHO2, FAS1, and ADO1–SOD1. Per-base pair RNA-seq coverage is plotted separately for forward and reverse reads after normalization to set the total coverage as equal in all samples. The profile for each genotype is the average of the normalized coverage maps from two biological replicates. Double slashes indicate where Spo11-oligo counts are off scale.

