Figure 1.
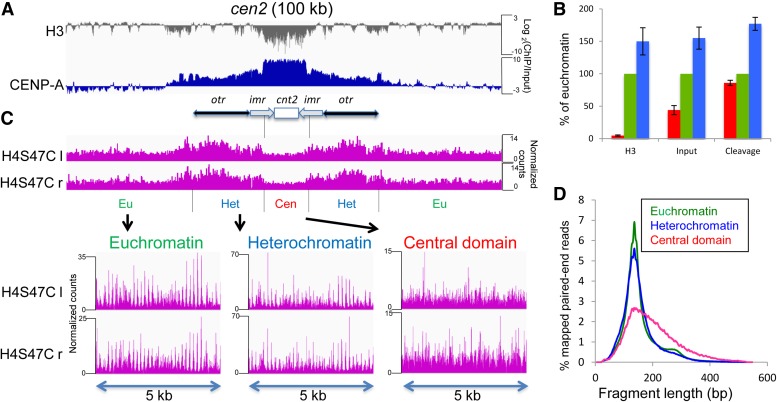
CENP-A nucleosomes are not positioned in the central domain. (A) A 100-kb region around cen2 is shown. The gray track plots the log-ratio of H3/input from published anti-H3 X-ChIP-Seq data sets (Kato et al. 2013). The blue track shows the log-ratio of CENP-A/input from an X-ChIP-Seq data set for CENP-A-HA. (B) Chromatin occupancy of H3 and Input, or cleavage density are shown in the central domain (red), euchromatin (green), and heterochromatin (blue) as percentages of the average value in euchromatin. (C) The magenta tracks show the frequency of the left (l) and right (r) endpoints of H4S47C-anchored cleavage fragments around cen2, respectively. Expansions of cleavage fragment endpoints in selected 5-kb regions from euchromatin, heterochromatin, and the central domain are shown below. Similar profiles were obtained for cen1 and cen3 (Figure S1). For visual clarity, normalized count occupancies were scaled to the maximum occupancy in each track using the IGV Genome Browser, and the same scaling method was used for the bottom three tracks in the expansions. (D) Distribution of nucleosome-to-nucleosome H4S47C-anchored cleavage fragment lengths in euchromatin, heterochromatin, and the central domain.

