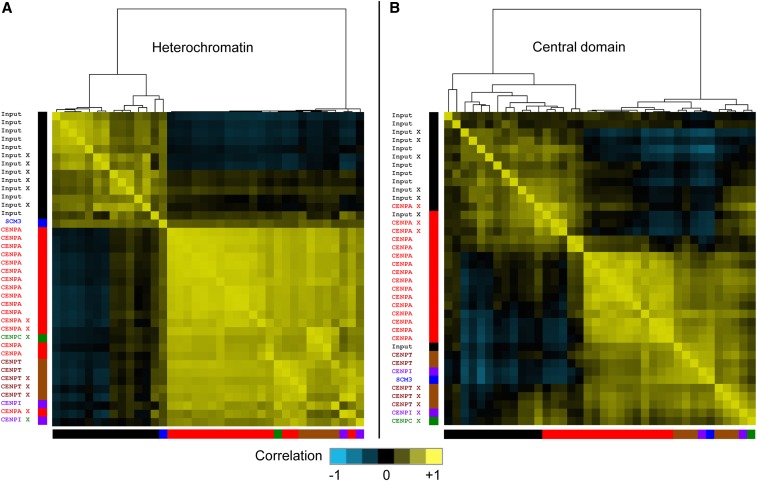
Figure 5.
Heterogeneous correlations between CENP-A ChIP data sets in central domains. Pearson correlation coefficients for all 38 data sets within the combined (A) pericentric heterochromatin and (B) central domains were subjected to hierarchical clustering. Correlation coefficients between normalized counts from cen1, cen2, and cen3 are represented as a heat map. Colors of the bars at the bottom and left side of each heat map indicate the protein targeted by ChIP for: input (black); CENP-A (red); CENP-C (green); CENP-I (purple); CENP-T (brown); and Scm3 (blue). X-ChIP samples are indicated (X). No unique clustering of CENP-A separate from input or other CENPs is seen for central domains, suggesting that the preferences seen in the CENP-A profiles are more likely attributable to technical differences between data sets than to biological differences.

