Figure 5.
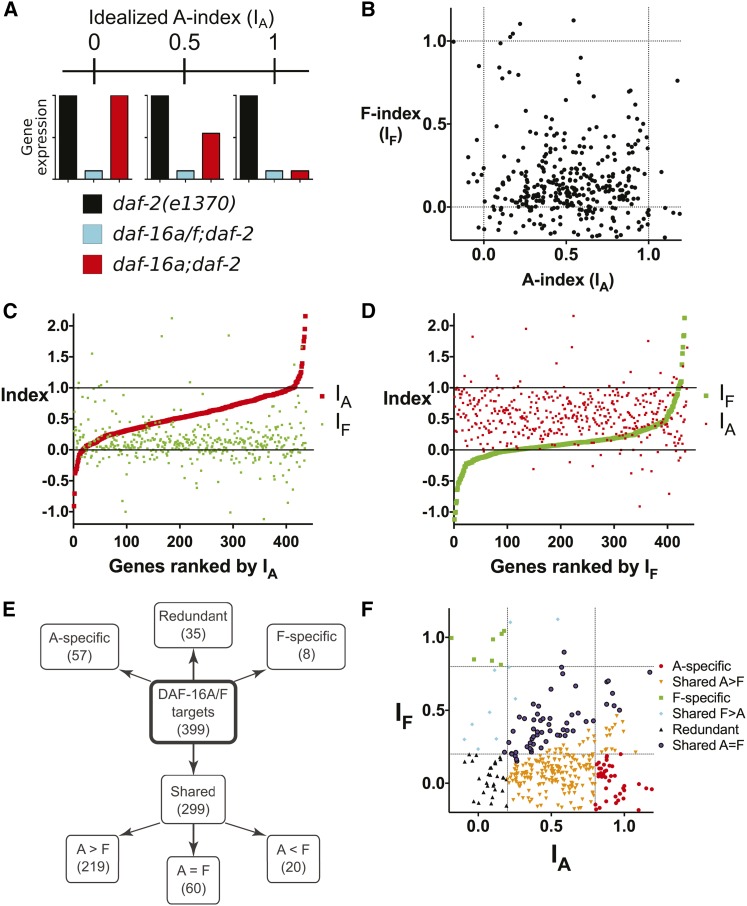
DAF-16A and DAF-16F target genes identified by whole transcriptome profiling. (A) Depiction of the A-index (IA) for three hypothetical target genes with IA = 0, 0.5, and 1.0. Idealized expression profiles in daf-2(e1370), daf-16a/f;daf-2, and daf-16a;daf-2 are shown for all three genes. (B) Scatterplot comparing IA and IF for DAF-16A/F target genes. Dashed lines indicate IA and IF = 0 or 1. Only genes with indices from −0.2 to 1.2 are shown; a scatterplot with a wider range of indices is shown in Figure S15. IA and IF for all genes are listed in Table S13. (C and D) Plots of IA and IF for all DAF-16A/F target genes from lowest to highest IA (C) or IF (D). Solid lines correspond to indices of 0 and 1. Three genes with indices >2.2 or < −1.2 were omitted for presentation purposes. Gene rankings are listed in Table S13. (E) Tree diagram summarizing the categorization system for DAF-16A and DAF-16F target genes. See text and Materials and Methods for details. (F) Scatterplot from B, with individual genes color coded according to categories depicted in E. Dashed lines indicate IA or IF values of 0.2 or 0.8, corresponding to the cutoffs used to define redundantly regulated, A-specific, and F-specific targets.

