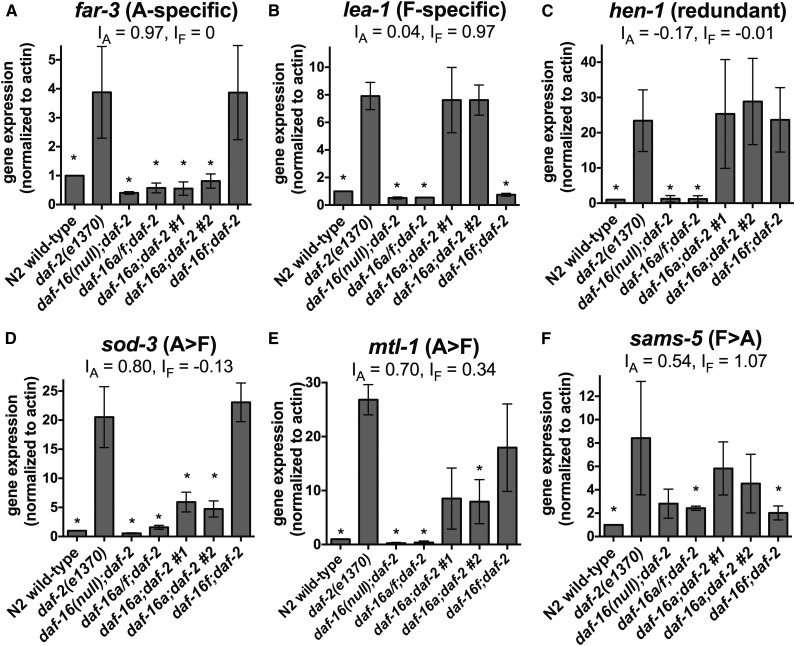
Figure 6.
qPCR validation of target gene regulation by DAF-16A and DAF-16F. (A–F) Expression of six DAF-16A/F target genes quantified by qPCR using RNA isolated from day 1 young adult animals. Values represent the mean from three biological replicates. Error bars represent standard deviation. Asterisks indicate statistically significant changes (P < 0.05 by paired ratio t-test). IA and IF were calculated using mean expression values measured by qPCR, and correlate with indices calculated using RNA-seq measurements (Table S16). Statistics and data are summarized in Table S14.

