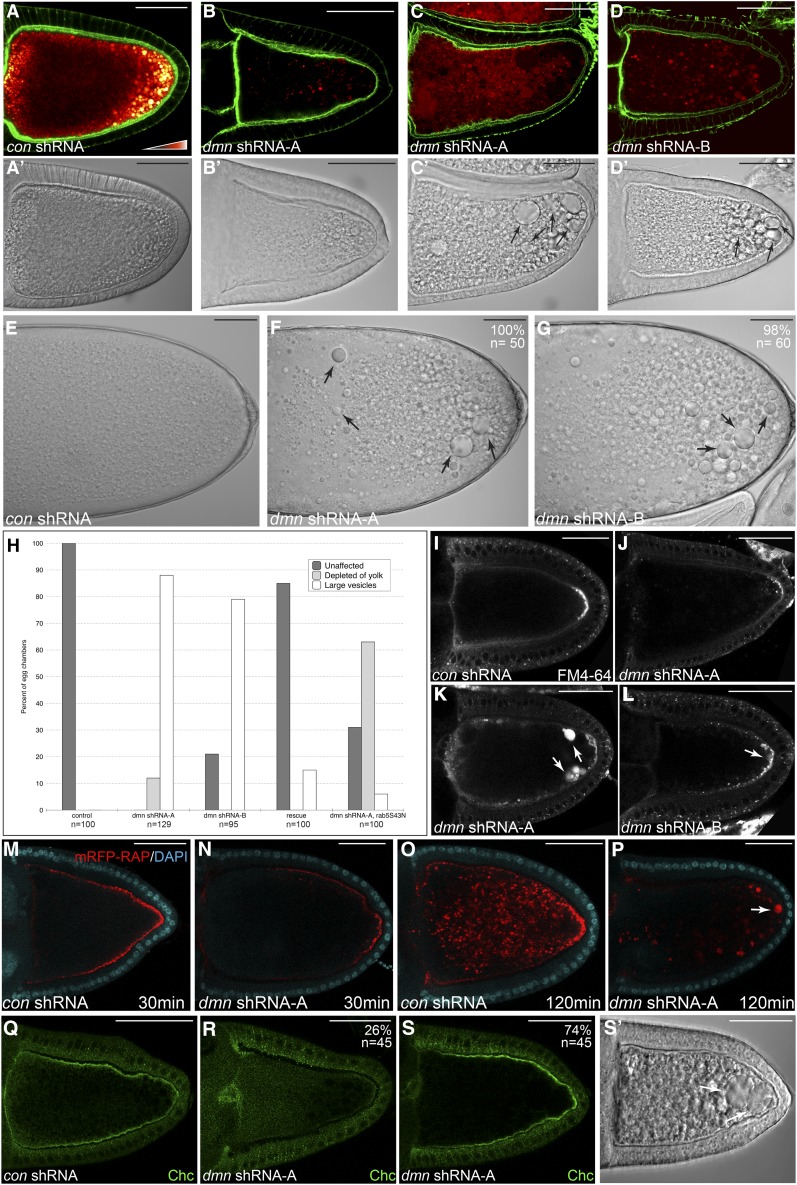
Figure 2.
Dmn depletion phenotypes. (A–D) Egg chambers expressing a control shRNA (A), dmn shRNA-A (B and C), or dmn shRNA-B (D) were fixed and stained to reveal the actin cytoskeleton (green). Autofluorescent yolk particles are displayed using a color-coded range indicator. Black indicates low levels of signal, red indicates moderate signal, and white indicates high levels of signal. DIC images of these egg chambers are shown in A′, B′, C′ and D′. The arrows indicate enlarged vesicular structures. (E–G) DIC images of mature stage 14 egg chambers expressing a control shRNA (E), dmn shRNA-A (F), or dmn shRNA-B (G) are shown. The penetrance of the indicated phenotypes and the number of egg chambers counted are indicated. (H) Quantification of endocytic phenotypes. Egg chambers from the indicated genotypes were scored for the presence of yolk and large vesicular structures. The percentage of each phenotype observed and the number of egg chambers counted for each genotype are indicated. “Rescue” indicates flies that are coexpressing dmn shRNA-A and GFP-dmnref. dmn shRNA-A and rab5S43N were coexpressed using the maternal α-tubulin driver. (I–L) Egg chambers expressing a control shRNA (I), dmn shRNA-A (J and K), or dmn shRNA-B (L) were processed for FM4-64 uptake. The egg chambers were mounted on slides and imaged live. Large vesicles that were positive for FM4-64 are indicated by arrows. (M and N) Egg chambers expressing a control shRNA (M) or dmn shRNA-A (N) were processed for mRFP-RAP endocytosis (red). The egg chambers were incubated with mRFP-RAP for 30 min. They were then fixed and stained with DAPI to reveal nuclei (cyan). (O and P) Egg chambers from these same strains were incubated with mRFP-RAP for 120 min to monitor endocytic maturation (red). They were then fixed and stained with DAPI to reveal nuclei (cyan). The arrow indicates enlarged mRFP-RAP endosomes. (Q–S) Egg chambers expressing a control shRNA (Q) or dmn shRNA-A (R and S) were fixed and processed for immunofluorescence using an antibody against Chc (green). S′ represents the DIC image of the oocyte in S. The white arrows in S′ indicate enlarged endosomes. The percentage of the phenotypes observed and the number of egg chambers counted are indicated. Bar, 50 μm.

