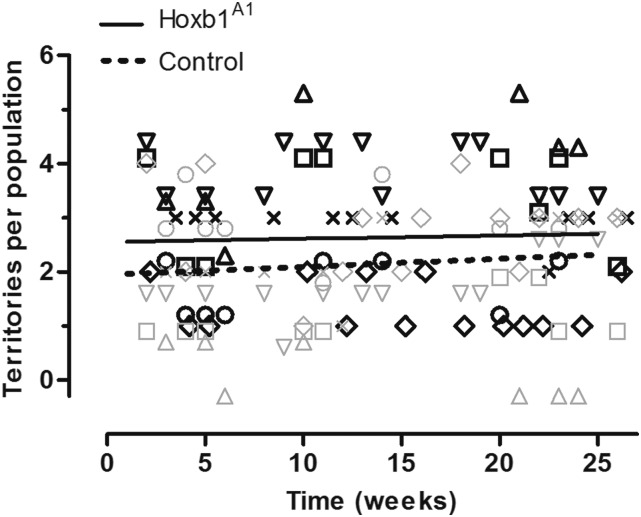
Figure 2.
Competitive ability of Hoxb1A1 and control founders in OPAs. A 10.6% reduction in the probability of territorial ownership of Hoxb1A1 founders was observed relative to control founders (GLMM; Z = 2.56, P = 0.010). Competitive ability of both groups was assessed at multiple time points across populations (n = 6) for a total of 124 observations. Provided lines are simple linear regressions based upon raw data to help illustrate overall trends. Observations from each population are demarcated by shape and paired at each time point (solid outline for control and shaded outline for Hoxb1A1 founders) and cannot sum to more than six, as this is the maximum number of territories per population. If more than one population was assessed at a given time, then data points from multiple populations appear in a column; vertical scatter was added to prevent overlap and aid in visualization.

