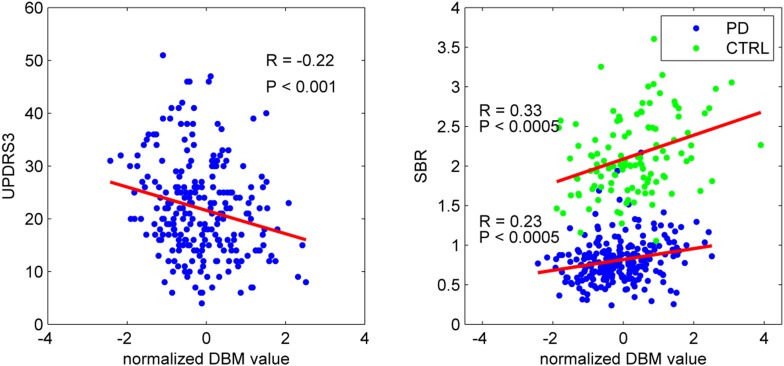
Figure 2. PD-ICA network, dopamine denervation, and severity of disease.
Left: Unified Parkinson's Disease Rating Scale (UPDRS) part III (a measure of motor function and disease severity—higher value means more severe disease) was significantly correlated with the degree of atrophy in the network (r = −0.22, p < 0.001). Right: plot of [123I]FP-CIT striatum binding ratio (SBR) vs deformation value in the PD-ICA (Figure 1). Correlation: r = 0.23, p < 0.0005 for PD patients, and r = 0.33, p < 0.0005 for age-matched controls.

